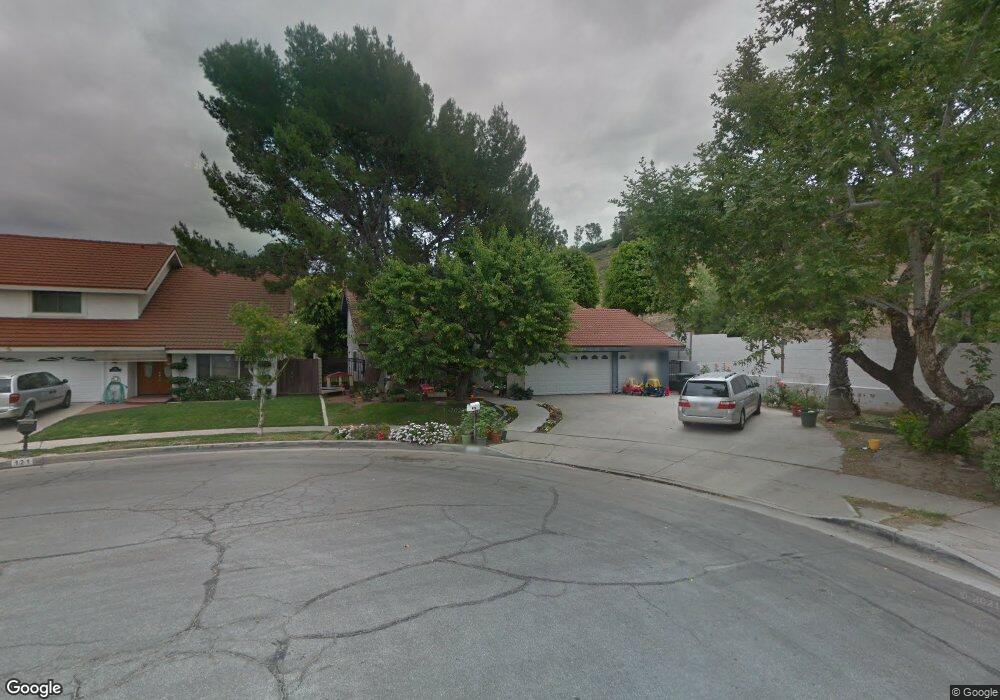
113 N Quail Ln Orange, CA 92869
Estimated Value: $1,327,547 - $1,678,000
4
Beds
3
Baths
2,839
Sq Ft
$508/Sq Ft
Est. Value
About This Home
This home is located at 113 N Quail Ln, Orange, CA 92869 and is currently estimated at $1,441,137, approximately $507 per square foot. 113 N Quail Ln is a home located in Orange County with nearby schools including Esplanade Elementary School, El Modena High School, and Orange County Classical Academy.
Ownership History
Date
Name
Owned For
Owner Type
Purchase Details
Closed on
Jan 20, 2021
Sold by
Zumkehr John F and Zumkehr Jean Y
Bought by
Zumkehr John F and Zumkehr Jean Y
Current Estimated Value
Home Financials for this Owner
Home Financials are based on the most recent Mortgage that was taken out on this home.
Original Mortgage
$332,000
Interest Rate
2.7%
Mortgage Type
New Conventional
Purchase Details
Closed on
May 18, 2017
Sold by
Zumkehr John F and Zumkehr Jean Y
Bought by
Zumkehr John F and Zumkehr Jean Y
Purchase Details
Closed on
Mar 13, 2017
Sold by
Zumkehr John F and Zumkehr Jeanle Y
Bought by
Zumkehr John F and Zumkehr Jean Y
Home Financials for this Owner
Home Financials are based on the most recent Mortgage that was taken out on this home.
Original Mortgage
$424,000
Interest Rate
4.19%
Mortgage Type
New Conventional
Create a Home Valuation Report for This Property
The Home Valuation Report is an in-depth analysis detailing your home's value as well as a comparison with similar homes in the area
Home Values in the Area
Average Home Value in this Area
Purchase History
| Date | Buyer | Sale Price | Title Company |
|---|---|---|---|
| Zumkehr John F | -- | Accommodation | |
| Zumkehr John F | -- | Stewart Title Guaranty Co | |
| Zumkehr John F | -- | None Available | |
| Zumkehr John F | -- | Old Republic Title |
Source: Public Records
Mortgage History
| Date | Status | Borrower | Loan Amount |
|---|---|---|---|
| Closed | Zumkehr John F | $332,000 | |
| Closed | Zumkehr John F | $424,000 |
Source: Public Records
Tax History
| Year | Tax Paid | Tax Assessment Tax Assessment Total Assessment is a certain percentage of the fair market value that is determined by local assessors to be the total taxable value of land and additions on the property. | Land | Improvement |
|---|---|---|---|---|
| 2025 | $4,270 | $381,206 | $95,331 | $285,875 |
| 2024 | $4,270 | $373,732 | $93,462 | $280,270 |
| 2023 | $4,172 | $366,404 | $91,629 | $274,775 |
| 2022 | $4,088 | $359,220 | $89,832 | $269,388 |
| 2021 | $3,975 | $352,177 | $88,071 | $264,106 |
| 2020 | $3,938 | $348,566 | $87,168 | $261,398 |
| 2019 | $3,889 | $341,732 | $85,459 | $256,273 |
| 2018 | $3,829 | $335,032 | $83,783 | $251,249 |
| 2017 | $3,672 | $328,463 | $82,140 | $246,323 |
| 2016 | $3,601 | $322,023 | $80,529 | $241,494 |
| 2015 | $3,548 | $317,186 | $79,319 | $237,867 |
| 2014 | $3,471 | $310,973 | $77,765 | $233,208 |
Source: Public Records
Map
Nearby Homes
- 5722 E Stillwater Ave Unit 67
- 5722 E Stillwater Ave Unit 113
- 5722 E Stillwater Ave
- 190 N Singingwood St
- 130 S Waterwheel Way Unit 35
- 126 S Waterwheel Way
- 5744 E Creekside Ave Unit 37
- 6036 E Cadbury Dr Unit 53
- 12384 Circula Panorama
- 19091 E Country Hollow Unit 34
- 12348 Circula Panorama
- 19031 E Center Ave
- 19002 E Smiley Dr
- 6121 E Breton Cir
- 11701 Blackthorn Ln
- 12281 Alta Panorama
- 6242 E Inverness Place
- 12281 Baja Panorama
- 6307 E Rocking Horse Way
- 18921 E Berrytree Ln
- 121 N Quail Ln
- 129 N Quail Ln
- 114 N Roth Ln
- 122 N Roth Ln
- 112 N Quail Ln
- 130 N Roth Ln
- 139 N Quail Ln
- 120 N Quail Ln
- 128 N Quail Ln
- 140 N Roth Ln
- 147 N Quail Ln
- 12223 E Chapman Ave Unit 2
- 138 N Quail Ln
- 148 N Roth Ln
- 115 N Roth Ln
- 123 N Roth Ln
- 131 N Roth Ln
- 122 N Bobwhite Way
- 141 N Roth Ln
- 167 N Quail Ln
Your Personal Tour Guide
Ask me questions while you tour the home.