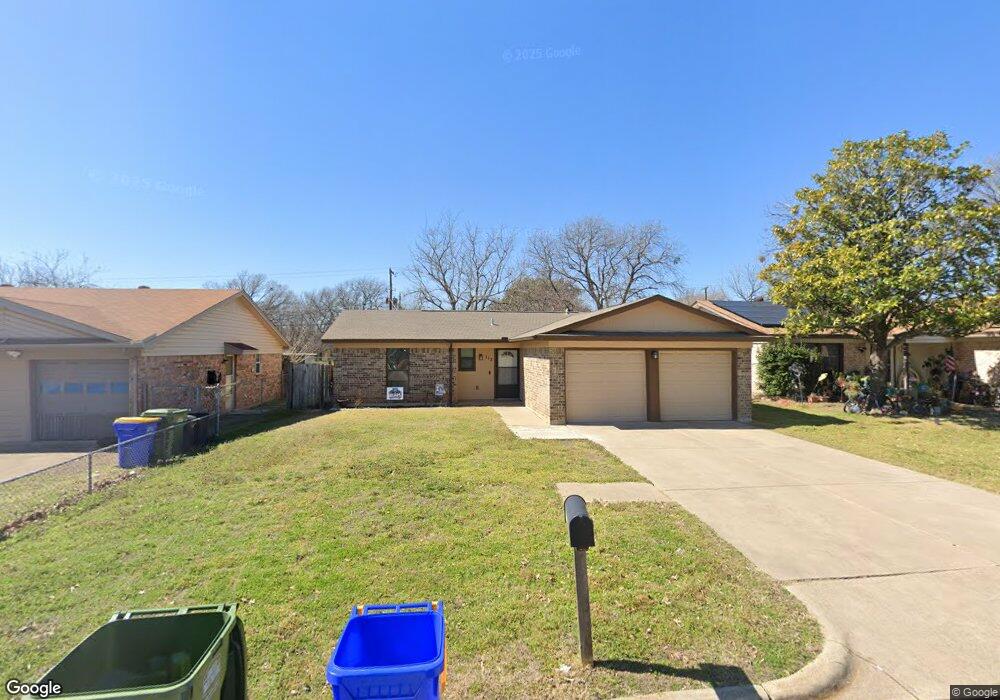
113 N Redford Ln Fort Worth, TX 76108
Estimated Value: $203,000 - $262,000
3
Beds
2
Baths
1,189
Sq Ft
$194/Sq Ft
Est. Value
About This Home
This home is located at 113 N Redford Ln, Fort Worth, TX 76108 and is currently estimated at $231,042, approximately $194 per square foot. 113 N Redford Ln is a home located in Tarrant County with nearby schools including West Elementary School, Brewer Middle School, and Tannahill Intermediate School.
Ownership History
Date
Name
Owned For
Owner Type
Purchase Details
Closed on
Mar 2, 2015
Sold by
Vantage Resources Llc
Bought by
Torres Jose
Current Estimated Value
Home Financials for this Owner
Home Financials are based on the most recent Mortgage that was taken out on this home.
Original Mortgage
$104,500
Outstanding Balance
$79,977
Interest Rate
3.66%
Mortgage Type
New Conventional
Estimated Equity
$151,065
Purchase Details
Closed on
Sep 29, 2014
Sold by
Averyt Peggy and Averyt Peggy Ann
Bought by
Vantage Resources Llc
Home Financials for this Owner
Home Financials are based on the most recent Mortgage that was taken out on this home.
Original Mortgage
$70,000
Interest Rate
4.14%
Mortgage Type
Purchase Money Mortgage
Purchase Details
Closed on
Nov 15, 1999
Sold by
Moore Ricky A and Moore Terri L
Bought by
Averyt Larry and Averyt Peggy
Purchase Details
Closed on
Mar 20, 1997
Sold by
Fore Edward M and Fore Myrtle
Bought by
Moore Ricky A and Moore Terri L
Home Financials for this Owner
Home Financials are based on the most recent Mortgage that was taken out on this home.
Original Mortgage
$47,500
Interest Rate
7.65%
Create a Home Valuation Report for This Property
The Home Valuation Report is an in-depth analysis detailing your home's value as well as a comparison with similar homes in the area
Home Values in the Area
Average Home Value in this Area
Purchase History
| Date | Buyer | Sale Price | Title Company |
|---|---|---|---|
| Torres Jose | -- | Providence Title Co | |
| Vantage Resources Llc | -- | Providence Title Co | |
| Averyt Larry | -- | Alamo Title Company | |
| Moore Ricky A | -- | Trinity Western Title Co |
Source: Public Records
Mortgage History
| Date | Status | Borrower | Loan Amount |
|---|---|---|---|
| Open | Torres Jose | $104,500 | |
| Previous Owner | Vantage Resources Llc | $70,000 | |
| Previous Owner | Moore Ricky A | $47,500 |
Source: Public Records
Tax History Compared to Growth
Tax History
| Year | Tax Paid | Tax Assessment Tax Assessment Total Assessment is a certain percentage of the fair market value that is determined by local assessors to be the total taxable value of land and additions on the property. | Land | Improvement |
|---|---|---|---|---|
| 2025 | $2,239 | $227,510 | $38,870 | $188,640 |
| 2024 | $2,239 | $227,510 | $38,870 | $188,640 |
| 2023 | $3,456 | $224,028 | $38,870 | $185,158 |
| 2022 | $3,578 | $183,141 | $25,000 | $158,141 |
| 2021 | $3,304 | $173,713 | $25,000 | $148,713 |
| 2020 | $3,026 | $143,356 | $25,000 | $118,356 |
| 2019 | $2,856 | $137,834 | $25,000 | $112,834 |
| 2018 | $2,079 | $90,247 | $12,000 | $78,247 |
| 2017 | $2,398 | $82,043 | $12,000 | $70,043 |
| 2016 | $2,996 | $102,520 | $12,000 | $90,520 |
| 2015 | $121 | $53,800 | $12,400 | $41,400 |
| 2014 | $121 | $53,800 | $12,400 | $41,400 |
Source: Public Records
Map
Nearby Homes
- 204 Lanham Ct
- 9200 Farmers Rd
- 9221 White Settlement Rd
- 201 N Normandale St
- 9100 Rowland Dr
- 2860 Fox Trail Ln
- 10937 Elata Dr
- 105 Lockwood St
- 9201 Clifford St
- 308 Hallvale Dr
- 8814 Clifford St
- 405 S Las Vegas Trail
- 407 S Las Vegas Trail
- 409 S Las Vegas Trail
- 411 S Las Vegas Trail
- 428 S Las Vegas Trail
- 304 Lockwood St
- 9005 Glenn Dr
- 508 Grant Cir
- 501 Allencrest Dr
- 109 N Redford Ln
- 117 N Redford Ln
- 117 N Redford Ln Unit TX
- 105 N Redford Ln
- 125 N Redford Ln
- 128 Myers Dr
- 101 N Redford Ln
- 124 Myers Dr
- 114 N Redford Ln
- 118 N Redford Ln
- 106 N Redford Ln
- 122 N Redford Ln
- 9108 White Settlement Rd
- 9102 White Settlement Rd
- 9100 White Settlement Rd
- 102 N Redford Ln
- 126 N Redford Ln
- 126 N Redford Ln Unit A
- 126 N Redford Ln Unit B
- 201 N Redford Ln