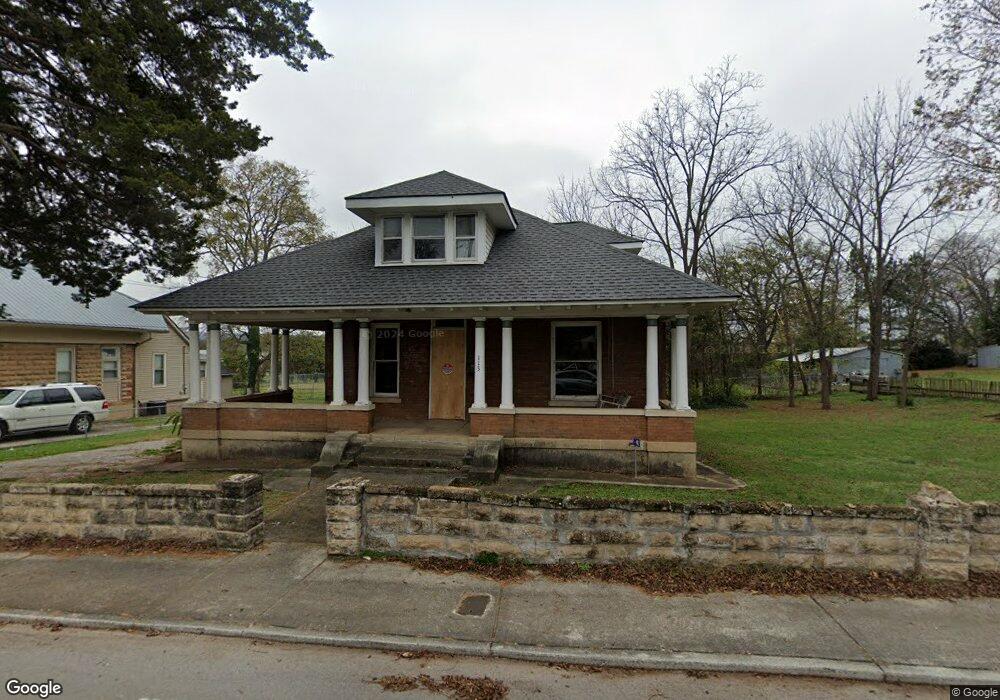
113 N Shephard St Winchester, TN 37398
Estimated Value: $198,000 - $276,000
3
Beds
1
Bath
1,600
Sq Ft
$140/Sq Ft
Est. Value
About This Home
This home is located at 113 N Shephard St, Winchester, TN 37398 and is currently estimated at $223,665, approximately $139 per square foot. 113 N Shephard St is a home located in Franklin County with nearby schools including South Middle School, Franklin County High School, and Winchester Christian Academy.
Ownership History
Date
Name
Owned For
Owner Type
Purchase Details
Closed on
Dec 14, 2006
Sold by
Franklin American Mortgage
Bought by
Smith Joe W
Current Estimated Value
Purchase Details
Closed on
Oct 23, 2006
Sold by
Citimortgage
Bought by
Franklin American Mortgage
Purchase Details
Closed on
Oct 5, 2006
Sold by
Federal National Mortgage Association
Bought by
Citimortgage Inc
Purchase Details
Closed on
Jan 7, 2005
Bought by
Federal National Mtg Assoc
Purchase Details
Closed on
Jul 3, 2002
Sold by
Albertson Robert L
Bought by
Joseph Urman
Home Financials for this Owner
Home Financials are based on the most recent Mortgage that was taken out on this home.
Original Mortgage
$56,810
Interest Rate
6.75%
Purchase Details
Closed on
Jul 21, 1978
Bought by
Metcalf Ralph and Metcalf Velma
Create a Home Valuation Report for This Property
The Home Valuation Report is an in-depth analysis detailing your home's value as well as a comparison with similar homes in the area
Home Values in the Area
Average Home Value in this Area
Purchase History
| Date | Buyer | Sale Price | Title Company |
|---|---|---|---|
| Smith Joe W | $24,111 | -- | |
| Franklin American Mortgage | -- | -- | |
| Citimortgage Inc | $55,951 | -- | |
| Federal National Mtg Assoc | $61,500 | -- | |
| Joseph Urman | $59,800 | -- | |
| Metcalf Ralph | -- | -- |
Source: Public Records
Mortgage History
| Date | Status | Borrower | Loan Amount |
|---|---|---|---|
| Previous Owner | Metcalf Ralph | $56,810 |
Source: Public Records
Tax History Compared to Growth
Tax History
| Year | Tax Paid | Tax Assessment Tax Assessment Total Assessment is a certain percentage of the fair market value that is determined by local assessors to be the total taxable value of land and additions on the property. | Land | Improvement |
|---|---|---|---|---|
| 2024 | $693 | $40,300 | $4,025 | $36,275 |
| 2023 | $693 | $40,300 | $4,025 | $36,275 |
| 2022 | $1,016 | $40,300 | $4,025 | $36,275 |
| 2021 | $583 | $40,300 | $4,025 | $36,275 |
| 2020 | $804 | $22,750 | $2,025 | $20,725 |
| 2019 | $804 | $22,750 | $2,025 | $20,725 |
| 2018 | $757 | $22,750 | $2,025 | $20,725 |
| 2017 | $757 | $22,750 | $2,025 | $20,725 |
| 2016 | $725 | $21,775 | $2,025 | $19,750 |
| 2015 | $725 | $21,775 | $2,025 | $19,750 |
| 2014 | $711 | $21,764 | $0 | $0 |
Source: Public Records
Map
Nearby Homes
- 105 N Shephard St
- 109 N Shephard St
- 301 N Shephard St
- 803 S Shephard St
- 203 Campfire Ct
- 209 N Jefferson St
- 311 N Jefferson St
- 201&203 3rd Ave NE
- 412 Rotary Dr
- 203 3rd Ave NE
- 407 Girton St
- 408 Style St
- 503 Elm St
- 407 Style St
- 119 Kenmore Ave
- 303 N Porter St
- 213 S Porter St
- 215 S Porter St
- 211 S Porter St
- 146 Island Way
- 111 N Shephard St
- 121 N Shephard St
- 414 2nd Ave NW
- 118 N Shephard St
- 413 2nd Ave NW
- 107 N Shephard St
- 509 3rd Ave NW
- 119 N Shephard St
- 410 2nd Ave NW
- 417 3rd Ave NW
- 411 2nd Ave NW
- 415 3rd Ave NW
- 406 2nd Ave NW
- 416 1st Ave NW
- 413 3rd Ave NW
- 508 3rd Ave NW
- 512 3rd Ave NW
- 404 2nd Ave NW Unit 402
- 301 Turner St
- 111 N Cedar St