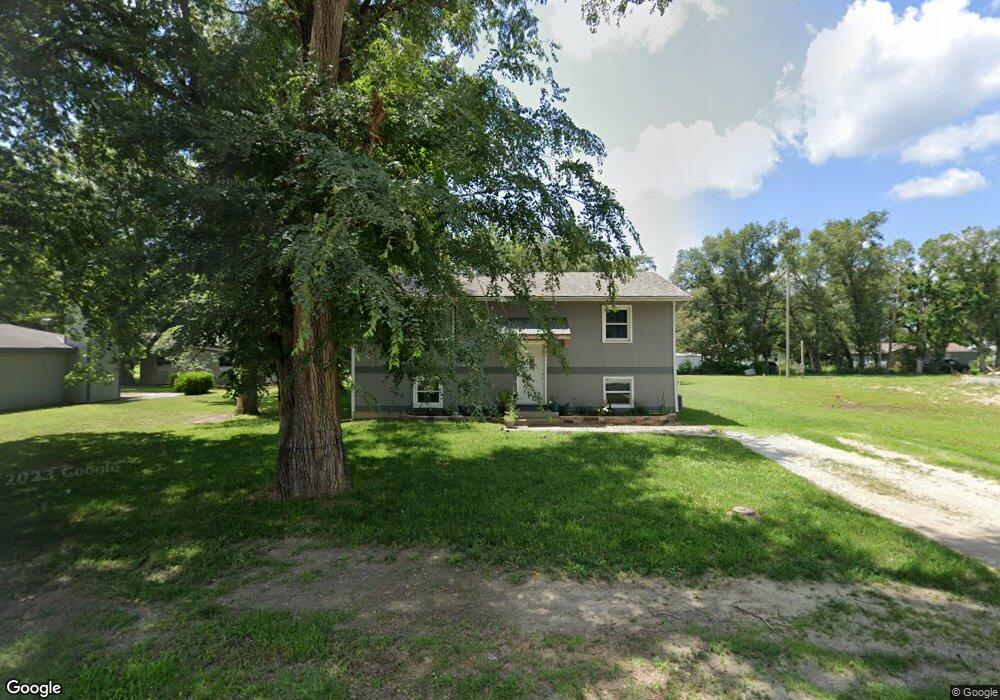
113 Olive St Belvue, KS 66407
Estimated Value: $130,000 - $188,000
4
Beds
1
Bath
864
Sq Ft
$197/Sq Ft
Est. Value
About This Home
This home is located at 113 Olive St, Belvue, KS 66407 and is currently estimated at $170,096, approximately $196 per square foot. 113 Olive St is a home located in Pottawatomie County with nearby schools including Central Elementary School, West Elementary School, and Wamego Middle School.
Ownership History
Date
Name
Owned For
Owner Type
Purchase Details
Closed on
Mar 24, 2020
Sold by
Je Properties Llc
Bought by
Carver Christopher and Carver Victoria
Current Estimated Value
Home Financials for this Owner
Home Financials are based on the most recent Mortgage that was taken out on this home.
Original Mortgage
$116,375
Outstanding Balance
$103,067
Interest Rate
3.5%
Mortgage Type
New Conventional
Estimated Equity
$67,029
Purchase Details
Closed on
Dec 2, 2010
Sold by
Finney John R
Bought by
J E Properties L L C
Purchase Details
Closed on
Jun 29, 2007
Sold by
J E Properties Llc
Bought by
Finney John R and Finney Jessica R
Create a Home Valuation Report for This Property
The Home Valuation Report is an in-depth analysis detailing your home's value as well as a comparison with similar homes in the area
Home Values in the Area
Average Home Value in this Area
Purchase History
| Date | Buyer | Sale Price | Title Company |
|---|---|---|---|
| Carver Christopher | -- | None Available | |
| J E Properties L L C | -- | None Available | |
| Finney John R | -- | None Available |
Source: Public Records
Mortgage History
| Date | Status | Borrower | Loan Amount |
|---|---|---|---|
| Open | Carver Christopher | $116,375 |
Source: Public Records
Tax History Compared to Growth
Tax History
| Year | Tax Paid | Tax Assessment Tax Assessment Total Assessment is a certain percentage of the fair market value that is determined by local assessors to be the total taxable value of land and additions on the property. | Land | Improvement |
|---|---|---|---|---|
| 2025 | $1,550 | $16,296 | $2,090 | $14,206 |
| 2024 | $16 | $15,697 | $1,682 | $14,015 |
| 2023 | $1,511 | $15,786 | $1,283 | $14,503 |
| 2022 | $1,155 | $14,697 | $877 | $13,820 |
| 2021 | $1,155 | $14,088 | $527 | $13,561 |
| 2020 | $1,155 | $12,259 | $581 | $11,678 |
| 2019 | $1,206 | $12,484 | $656 | $11,828 |
| 2018 | $1,261 | $12,858 | $656 | $12,202 |
| 2017 | $1,210 | $11,938 | $656 | $11,282 |
| 2016 | $1,186 | $11,247 | $590 | $10,657 |
| 2015 | -- | $10,742 | $590 | $10,152 |
| 2014 | -- | $10,753 | $519 | $10,234 |
Source: Public Records
Map
Nearby Homes
- 511 Anderson Ave
- 22310 Half Moon Rd
- 5520 Ambush Rd
- 00000 Lost Creek Rd
- 8325 Lost Creek Rd
- 00000 Tower Hill Rd
- Lot 1 Valley View Rd
- Lot 5 Valley View Rd
- Lot 20 Valley View Rd
- Lot 13 Valley View Rd
- Lot 4 Valley View Rd
- Lot 2 Valley View Rd
- Lot 17 Valley View Rd
- Lot 6 Valley View Rd
- Lot 19 Valley View Rd
- Lot 18 Valley View Rd
- Lot 24 Valley View Rd
- Lot 8 Valley View Rd
- 606 Oak St
- 300 W Durink St