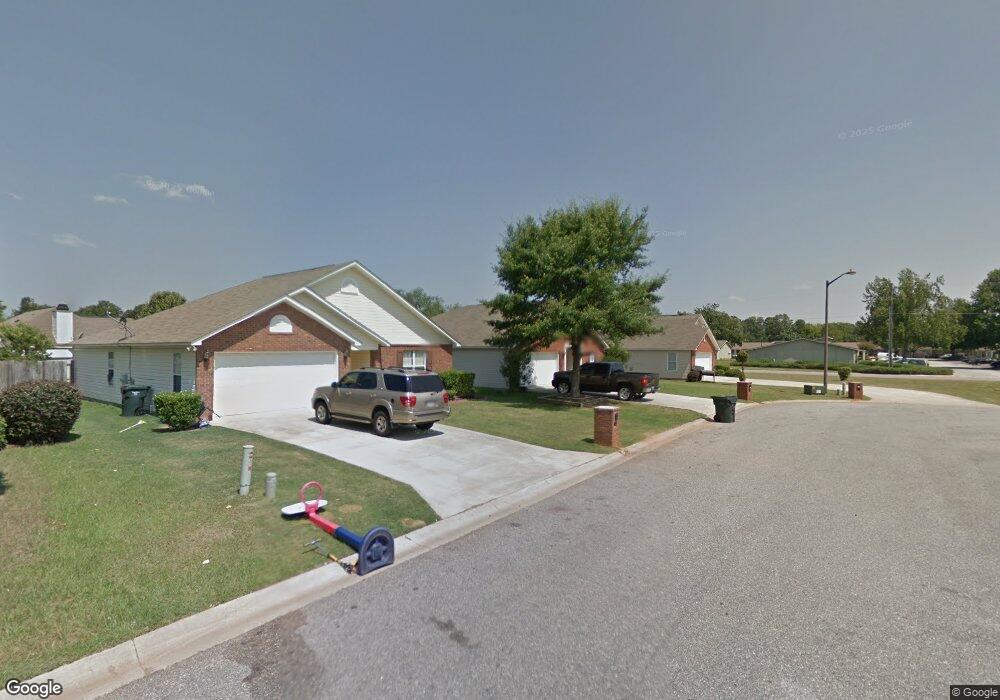
113 Onyx Ct Warner Robins, GA 31093
Estimated Value: $195,000 - $211,000
3
Beds
2
Baths
1,465
Sq Ft
$139/Sq Ft
Est. Value
About This Home
This home is located at 113 Onyx Ct, Warner Robins, GA 31093 and is currently estimated at $203,471, approximately $138 per square foot. 113 Onyx Ct is a home located in Houston County with nearby schools including Northside Elementary School, Northside Middle School, and Northside High School.
Ownership History
Date
Name
Owned For
Owner Type
Purchase Details
Closed on
Sep 19, 2008
Sold by
Secretary Of Housing & Urban Development
Bought by
Montford Dondrais Deante
Current Estimated Value
Home Financials for this Owner
Home Financials are based on the most recent Mortgage that was taken out on this home.
Original Mortgage
$95,816
Interest Rate
5.14%
Mortgage Type
FHA
Purchase Details
Closed on
Feb 5, 2008
Sold by
Georgia Housing & Finance Authority
Bought by
Hud
Purchase Details
Closed on
Jun 24, 2005
Sold by
La Loma Properties Inc
Bought by
Childs Bennie Prince
Purchase Details
Closed on
Aug 23, 2002
Sold by
Crowe James D and Crowe Elizabeth R
Bought by
La Loma Properties Inc
Purchase Details
Closed on
Apr 18, 2000
Sold by
International City Dev Inc
Bought by
Crowe James D and Crowe Elizabeth R
Purchase Details
Closed on
Mar 21, 2000
Bought by
International City Dev Inc
Create a Home Valuation Report for This Property
The Home Valuation Report is an in-depth analysis detailing your home's value as well as a comparison with similar homes in the area
Home Values in the Area
Average Home Value in this Area
Purchase History
| Date | Buyer | Sale Price | Title Company |
|---|---|---|---|
| Montford Dondrais Deante | -- | None Available | |
| Montford Dondrais Deante | $94,500 | -- | |
| Hud | -- | None Available | |
| Georgia Housing And Finance Authority | $107,500 | -- | |
| Childs Bennie Prince | $106,000 | -- | |
| La Loma Properties Inc | $100,000 | -- | |
| Crowe James D | $89,900 | -- | |
| International City Dev Inc | -- | -- |
Source: Public Records
Mortgage History
| Date | Status | Borrower | Loan Amount |
|---|---|---|---|
| Previous Owner | Montford Dondrais Deante | $95,816 |
Source: Public Records
Tax History
| Year | Tax Paid | Tax Assessment Tax Assessment Total Assessment is a certain percentage of the fair market value that is determined by local assessors to be the total taxable value of land and additions on the property. | Land | Improvement |
|---|---|---|---|---|
| 2025 | $1,873 | $68,040 | $8,000 | $60,040 |
| 2024 | $2,053 | $64,120 | $8,000 | $56,120 |
| 2023 | $1,877 | $58,320 | $6,000 | $52,320 |
| 2022 | $1,098 | $49,760 | $4,200 | $45,560 |
| 2021 | $912 | $41,440 | $4,200 | $37,240 |
| 2020 | $900 | $40,760 | $4,200 | $36,560 |
| 2019 | $900 | $40,760 | $4,200 | $36,560 |
| 2018 | $900 | $40,760 | $4,200 | $36,560 |
| 2017 | $901 | $40,760 | $4,200 | $36,560 |
| 2016 | $903 | $40,760 | $4,200 | $36,560 |
| 2015 | -- | $40,760 | $4,200 | $36,560 |
| 2014 | $407 | $40,760 | $4,200 | $36,560 |
| 2013 | $407 | $40,760 | $4,200 | $36,560 |
Source: Public Records
Map
Nearby Homes
- 107 Onyx Ct
- 105 Mitchell Ct
- 110 Mitchell Ct
- 317 Emory Dr
- 305 Norman Ln
- 110 Eastlake Dr
- 201 Inglewood Dr
- 111 Briarwood Dr
- 414 Forest Lake Dr
- 94 Tiffany Ln
- 106 Northspring Ct
- 501 Dunbar Rd
- 0 N Houston Rd Unit Northlake Dr.
- 302 Kensington Cir
- 113 Northwind Ct
- 208 Pellimore Dr
- 145 Kensington Cir
- 319 Air View Dr Unit 14
- 116 Kensington Cir
- 118 Avalon Dr
Your Personal Tour Guide
Ask me questions while you tour the home.