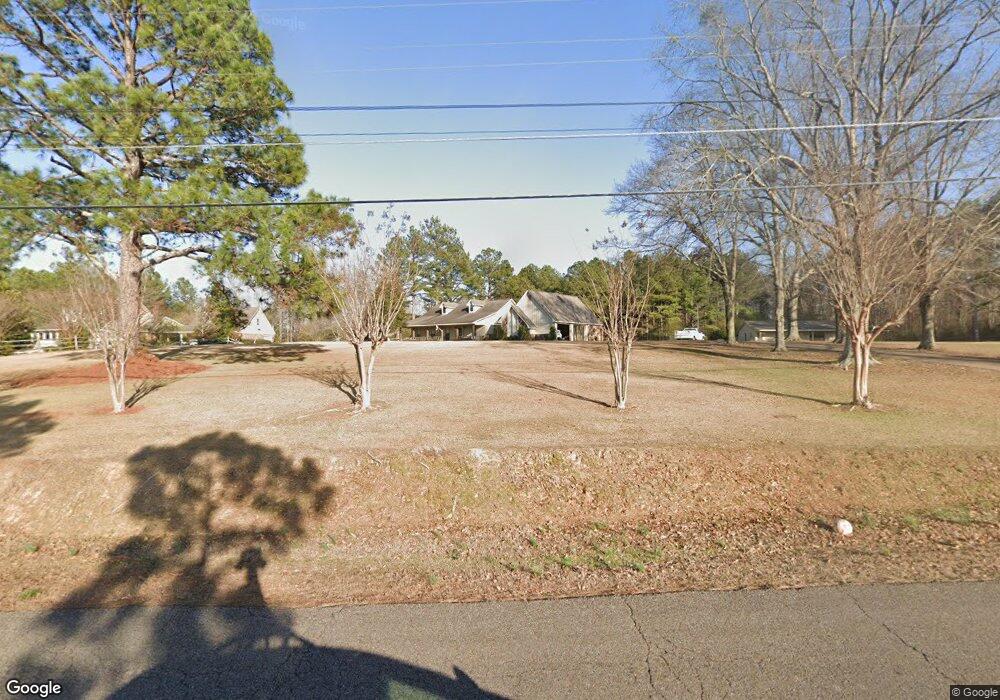
113 Pritchard Ln Columbus, MS 39702
Estimated Value: $424,000 - $545,000
--
Bed
1
Bath
4,385
Sq Ft
$110/Sq Ft
Est. Value
About This Home
This home is located at 113 Pritchard Ln, Columbus, MS 39702 and is currently estimated at $483,811, approximately $110 per square foot. 113 Pritchard Ln is a home.
Ownership History
Date
Name
Owned For
Owner Type
Purchase Details
Closed on
Jul 24, 2020
Sold by
Reis-Elbara Jason and Reis-Elbara Lisa
Bought by
Price Brian and Price Darrie
Current Estimated Value
Home Financials for this Owner
Home Financials are based on the most recent Mortgage that was taken out on this home.
Original Mortgage
$350,000
Outstanding Balance
$309,664
Interest Rate
3.1%
Mortgage Type
New Conventional
Estimated Equity
$174,147
Purchase Details
Closed on
Feb 8, 2019
Sold by
Johnson Stephanie B
Bought by
Reis-Elbara Jason and Reis-Elbara Lisa
Home Financials for this Owner
Home Financials are based on the most recent Mortgage that was taken out on this home.
Original Mortgage
$330,000
Interest Rate
4.4%
Mortgage Type
VA
Purchase Details
Closed on
Mar 12, 2015
Sold by
Johnson Louis D
Bought by
Johnson Stephanie B
Purchase Details
Closed on
Aug 22, 2006
Sold by
Miller Mark A and Miller Elizabeth M
Bought by
Garrison Raymond and Garrison Rebecca
Home Financials for this Owner
Home Financials are based on the most recent Mortgage that was taken out on this home.
Original Mortgage
$244,000
Interest Rate
6.73%
Create a Home Valuation Report for This Property
The Home Valuation Report is an in-depth analysis detailing your home's value as well as a comparison with similar homes in the area
Home Values in the Area
Average Home Value in this Area
Purchase History
| Date | Buyer | Sale Price | Title Company |
|---|---|---|---|
| Price Brian | -- | None Available | |
| Reis-Elbara Jason | -- | -- | |
| Johnson Stephanie B | -- | Attorney | |
| Garrison Raymond | -- | -- |
Source: Public Records
Mortgage History
| Date | Status | Borrower | Loan Amount |
|---|---|---|---|
| Open | Price Brian | $350,000 | |
| Previous Owner | Reis-Elbara Jason | $330,000 | |
| Previous Owner | Garrison Raymond | $244,000 |
Source: Public Records
Tax History Compared to Growth
Tax History
| Year | Tax Paid | Tax Assessment Tax Assessment Total Assessment is a certain percentage of the fair market value that is determined by local assessors to be the total taxable value of land and additions on the property. | Land | Improvement |
|---|---|---|---|---|
| 2025 | $3,419 | $38,014 | $0 | $0 |
| 2024 | $3,389 | $38,014 | $0 | $0 |
| 2023 | $2,688 | $30,923 | $0 | $0 |
| 2022 | $2,690 | $30,923 | $0 | $0 |
| 2021 | $2,580 | $30,923 | $0 | $0 |
| 2020 | $4,083 | $46,385 | $0 | $0 |
| 2019 | $2,024 | $36,256 | $0 | $0 |
| 2018 | $2,024 | $25,620 | $0 | $0 |
| 2017 | $1,922 | $25,620 | $0 | $0 |
| 2016 | $1,922 | $25,620 | $0 | $0 |
| 2015 | $1,959 | $26,055 | $0 | $0 |
| 2014 | $1,959 | $26,055 | $0 | $0 |
Source: Public Records
Map
Nearby Homes
- 61 Pritchard Ln
- 76 Pritchard Ln
- 116 Pritchard Ln
- 124 Pritchard Ln
- 2660 Lake Lowndes Rd
- 204 Pritchard Ln
- 74 Saum Dr
- 303 Pritchard Ln
- 323 Pritchard Ln
- 2379 Lake Lowndes Rd
- 2377 Lake Lowndes Rd
- 95 Hope Springs Dr
- 2798 Lake Lowndes Rd
- 48 Quail Run Dr
- 324 Pritchard Ln
- 142 Hope Springs Dr
- 60 Quail Run Dr
- 325 Pritchard Ln
- 2287 Lake Lowndes Rd
- 202 Saum Dr