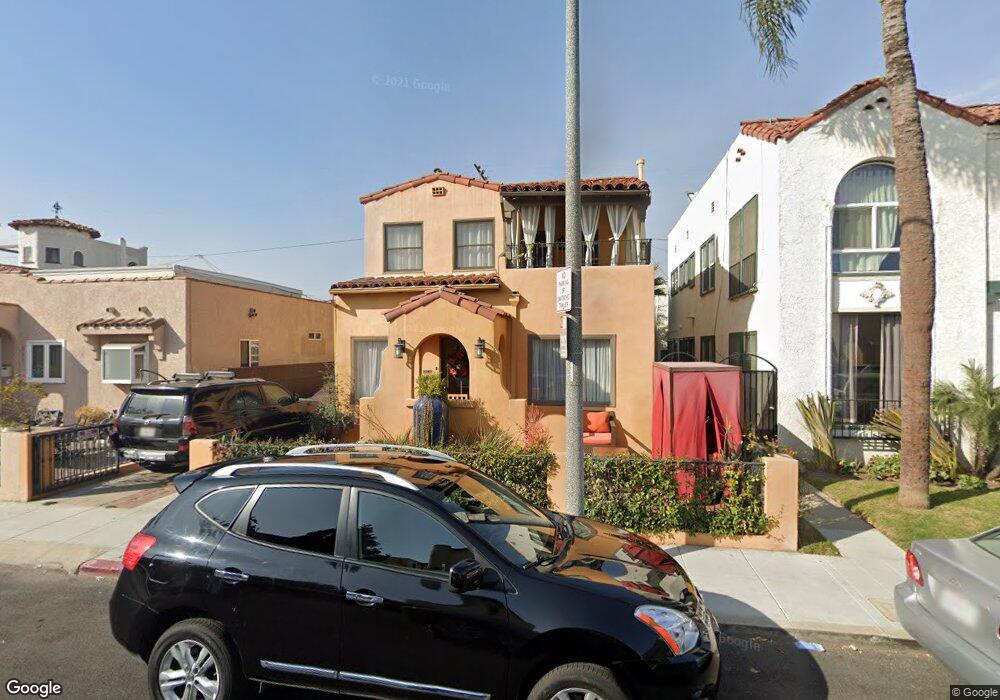
113 Prospect Ave Long Beach, CA 90803
Belmont Shore NeighborhoodEstimated Value: $1,479,000 - $1,613,000
4
Beds
2
Baths
1,654
Sq Ft
$943/Sq Ft
Est. Value
About This Home
This home is located at 113 Prospect Ave, Long Beach, CA 90803 and is currently estimated at $1,559,124, approximately $942 per square foot. 113 Prospect Ave is a home located in Los Angeles County with nearby schools including Lowell Elementary School, Rogers Middle School, and Woodrow Wilson High School.
Ownership History
Date
Name
Owned For
Owner Type
Purchase Details
Closed on
Aug 13, 2021
Sold by
Rosenthal James E and Nguyen Sam P
Bought by
Rosenthal James E and Nguyen Sam P
Current Estimated Value
Home Financials for this Owner
Home Financials are based on the most recent Mortgage that was taken out on this home.
Original Mortgage
$820,000
Outstanding Balance
$737,959
Interest Rate
2.8%
Mortgage Type
New Conventional
Estimated Equity
$821,165
Purchase Details
Closed on
May 16, 2016
Sold by
Rosenthal James E
Bought by
Rosenthal James E and Nguyen Sam P
Home Financials for this Owner
Home Financials are based on the most recent Mortgage that was taken out on this home.
Original Mortgage
$498,000
Interest Rate
3.58%
Mortgage Type
New Conventional
Purchase Details
Closed on
Sep 30, 2011
Sold by
Laris Paul and Laris A B
Bought by
Rosenthal James E
Home Financials for this Owner
Home Financials are based on the most recent Mortgage that was taken out on this home.
Original Mortgage
$547,500
Interest Rate
4.05%
Mortgage Type
New Conventional
Purchase Details
Closed on
Jul 23, 2002
Sold by
Hall David M and Nott Laura S
Bought by
Laris Paul and Laris A B
Home Financials for this Owner
Home Financials are based on the most recent Mortgage that was taken out on this home.
Original Mortgage
$351,852
Interest Rate
6.6%
Create a Home Valuation Report for This Property
The Home Valuation Report is an in-depth analysis detailing your home's value as well as a comparison with similar homes in the area
Home Values in the Area
Average Home Value in this Area
Purchase History
| Date | Buyer | Sale Price | Title Company |
|---|---|---|---|
| Rosenthal James E | -- | Pacific Coast Title | |
| Rosenthal James E | -- | Servicelink | |
| Rosenthal James E | $730,000 | Chicago Title Company | |
| Laris Paul | $654,000 | North American Title Co |
Source: Public Records
Mortgage History
| Date | Status | Borrower | Loan Amount |
|---|---|---|---|
| Open | Rosenthal James E | $820,000 | |
| Previous Owner | Rosenthal James E | $498,000 | |
| Previous Owner | Rosenthal James E | $547,500 | |
| Previous Owner | Laris Paul | $351,852 |
Source: Public Records
Tax History
| Year | Tax Paid | Tax Assessment Tax Assessment Total Assessment is a certain percentage of the fair market value that is determined by local assessors to be the total taxable value of land and additions on the property. | Land | Improvement |
|---|---|---|---|---|
| 2025 | $18,617 | $1,432,630 | $1,146,104 | $286,526 |
| 2024 | $17,837 | $1,404,540 | $1,123,632 | $280,908 |
| 2023 | $17,543 | $1,377,000 | $1,101,600 | $275,400 |
| 2022 | $16,451 | $1,350,000 | $1,080,000 | $270,000 |
| 2021 | $11,674 | $948,489 | $612,244 | $336,245 |
| 2020 | $11,644 | $938,765 | $605,967 | $332,798 |
| 2019 | $11,507 | $920,359 | $594,086 | $326,273 |
| 2018 | $11,190 | $902,314 | $582,438 | $319,876 |
| 2016 | $9,141 | $774,556 | $619,646 | $154,910 |
| 2015 | $8,767 | $762,923 | $610,339 | $152,584 |
| 2014 | $8,697 | $747,980 | $598,384 | $149,596 |
Source: Public Records
Map
Nearby Homes
- 111 Ximeno Ave
- 4401 E Division St
- 105 Roswell Ave
- 118 Roycroft Ave
- 132 Belmont Ave
- 104 Saint Joseph Ave
- 116 Termino Ave
- 140 Saint Joseph Ave
- 150 Saint Joseph Ave
- 74 Argonne Ave
- 219 Ximeno Ave
- 28 Argonne Ave
- 75 Granada Ave
- 4527 E Shaw St
- 153 Granada Ave
- 202 Mira Mar Ave
- 3811 E Livingston Dr Unit 1
- 207 Mira Mar Ave
- 16 38th Place
- 210 Grand Ave Unit 201
- 111 Prospect Ave
- 115 Prospect Ave
- 107 Prospect Ave
- 117 Prospect Ave
- 114 Ximeno Ave
- 105 Prospect Ave
- 110 Ximeno Ave
- 121 Prospect Ave
- 108 Ximeno Ave
- 114 Prospect Ave
- 116 Prospect Ave
- 4427 E 1st St
- 123 Prospect Ave
- 104 Ximeno Ave
- 122 Ximeno Ave
- 106 Prospect Ave
- 124 Prospect Ave Unit 3
- 124 Prospect Ave
- 4401 E 1st St
- 124 Ximeno Ave
Your Personal Tour Guide
Ask me questions while you tour the home.