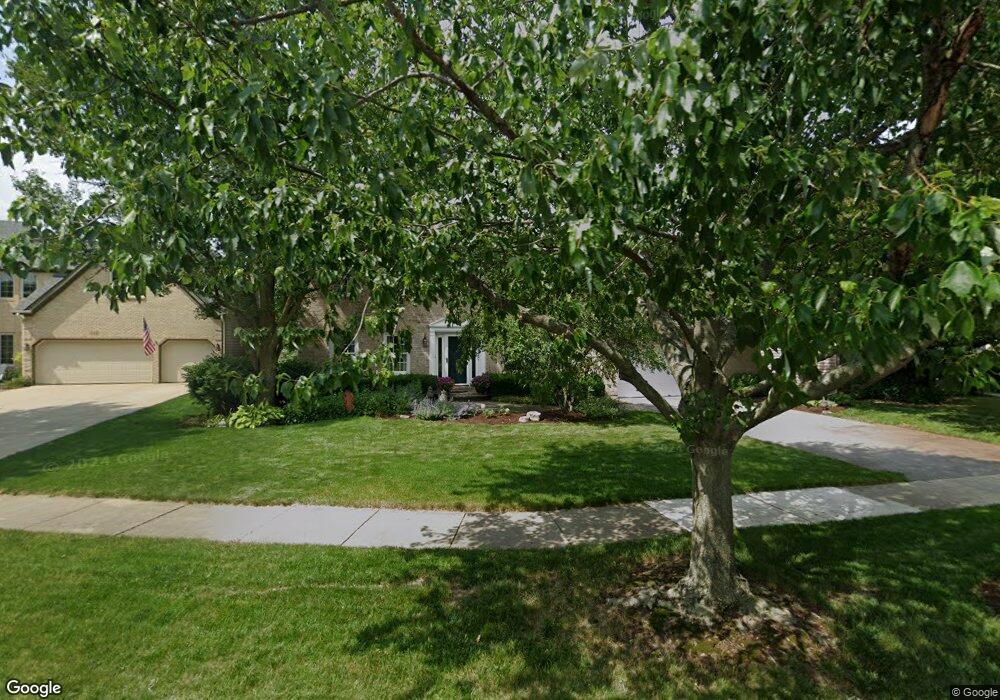
113 Red River Ct Naperville, IL 60565
River Woods NeighborhoodEstimated Value: $736,000 - $828,000
4
Beds
3
Baths
2,850
Sq Ft
$272/Sq Ft
Est. Value
About This Home
This home is located at 113 Red River Ct, Naperville, IL 60565 and is currently estimated at $775,262, approximately $272 per square foot. 113 Red River Ct is a home located in Will County with nearby schools including River Woods Elementary School, Madison Jr High School, and Naperville Central High School.
Ownership History
Date
Name
Owned For
Owner Type
Purchase Details
Closed on
Jun 19, 2019
Sold by
Fitzgerald K Shane and Fitzgerald Lisa S
Bought by
Fitzgerald K Shane and Fitzgerald Lisa S
Current Estimated Value
Purchase Details
Closed on
Nov 27, 1998
Sold by
Kasner Kenneth R and Kasner Barbara J
Bought by
Fitzgerald K Shane and Fitzgerald Lisa S
Home Financials for this Owner
Home Financials are based on the most recent Mortgage that was taken out on this home.
Original Mortgage
$255,000
Outstanding Balance
$58,674
Interest Rate
6.93%
Estimated Equity
$716,588
Purchase Details
Closed on
Jun 22, 1995
Sold by
Price Mark A and Price Pamela A
Bought by
Kasner Kenneth R and Kasner Barbara J
Home Financials for this Owner
Home Financials are based on the most recent Mortgage that was taken out on this home.
Original Mortgage
$235,200
Interest Rate
7.9%
Create a Home Valuation Report for This Property
The Home Valuation Report is an in-depth analysis detailing your home's value as well as a comparison with similar homes in the area
Home Values in the Area
Average Home Value in this Area
Purchase History
| Date | Buyer | Sale Price | Title Company |
|---|---|---|---|
| Fitzgerald K Shane | -- | Attorney | |
| Fitzgerald K Shane | $354,000 | Lawyers Title Pick Up | |
| Kasner Kenneth R | $294,000 | -- |
Source: Public Records
Mortgage History
| Date | Status | Borrower | Loan Amount |
|---|---|---|---|
| Open | Fitzgerald K Shane | $255,000 | |
| Previous Owner | Kasner Kenneth R | $235,200 |
Source: Public Records
Tax History Compared to Growth
Tax History
| Year | Tax Paid | Tax Assessment Tax Assessment Total Assessment is a certain percentage of the fair market value that is determined by local assessors to be the total taxable value of land and additions on the property. | Land | Improvement |
|---|---|---|---|---|
| 2024 | $13,990 | $224,838 | $44,254 | $180,584 |
| 2023 | $13,990 | $202,301 | $39,818 | $162,483 |
| 2022 | $12,133 | $182,385 | $35,898 | $146,487 |
| 2021 | $11,324 | $170,533 | $33,565 | $136,968 |
| 2020 | $10,898 | $164,925 | $32,461 | $132,464 |
| 2019 | $10,525 | $157,071 | $30,915 | $126,156 |
| 2018 | $10,045 | $150,336 | $29,589 | $120,747 |
| 2017 | $10,793 | $158,331 | $31,162 | $127,169 |
| 2016 | $10,879 | $157,000 | $30,900 | $126,100 |
| 2015 | $10,970 | $150,600 | $29,600 | $121,000 |
| 2014 | $10,970 | $146,200 | $28,700 | $117,500 |
| 2013 | $10,970 | $143,300 | $28,100 | $115,200 |
Source: Public Records
Map
Nearby Homes
- 2279 Kaskaskia Ct
- 2276 Kaskaskia Ct
- 2421 River Woods Dr
- 2280 Barth Dr
- 23 Glencoe Ct Unit 202B
- 36 Oak Bluff Ct
- 2132 Berkley Ct Unit 201A
- 47 Glencoe Ct Unit 102D
- 44 Oak Bluff Ct
- 221 Hampshire Ct Unit 201D
- 2697 Fox River Ln
- 2575 River Woods Dr
- 336 Brooklea Ct
- 2337 Worthing Dr Unit 102A
- 15 Pinnacle Ct
- 20 Pinnacle Ct
- 312 Leeds Ct
- 302 Carriage Hill Rd
- 51 Ford Ln
- 705 Potomac Ave
- 109 Red River Ct
- 117 Red River Ct
- 105 Red River Ct
- 112 Red River Ct
- 104 Arlington Ave
- 108 Red River Ct
- 101 Red River Ct
- 104 Red River Ct
- 2308 Kalamazoo Dr
- 2304 Kalamazoo Dr
- 2306 River Woods Dr
- 2319 Kalamazoo Dr
- 2300 River Woods Dr
- 2312 Kalamazoo Dr
- 100 Red River Ct
- 2312 River Woods Dr
- 2316 Kalamazoo Dr
- 2280 Kaskaskia Ct
- 115 Mackinaw Ct
- 111 Mackinaw Ct