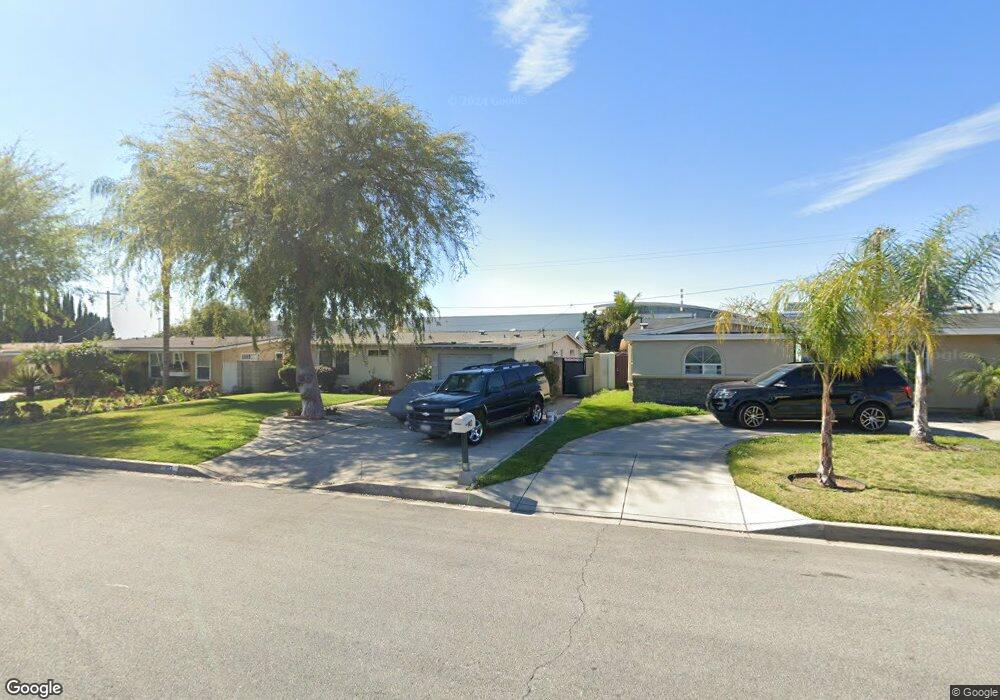
113 S Baymar St West Covina, CA 91791
Estimated Value: $725,000 - $828,000
4
Beds
2
Baths
1,115
Sq Ft
$699/Sq Ft
Est. Value
About This Home
This home is located at 113 S Baymar St, West Covina, CA 91791 and is currently estimated at $779,389, approximately $699 per square foot. 113 S Baymar St is a home located in Los Angeles County with nearby schools including Vine Elementary School, Hollencrest Middle School, and West Covina High School.
Ownership History
Date
Name
Owned For
Owner Type
Purchase Details
Closed on
Jul 26, 2018
Sold by
Delgadillo Jesus
Bought by
Delgadillo Jesus and Santos Delgadillo Cristiana
Current Estimated Value
Home Financials for this Owner
Home Financials are based on the most recent Mortgage that was taken out on this home.
Original Mortgage
$309,583
Outstanding Balance
$269,447
Interest Rate
4.6%
Mortgage Type
New Conventional
Estimated Equity
$509,942
Purchase Details
Closed on
Jun 19, 1998
Sold by
Home Svgs Of America Fsb
Bought by
Delgadillo Jesus
Home Financials for this Owner
Home Financials are based on the most recent Mortgage that was taken out on this home.
Original Mortgage
$126,800
Interest Rate
7.17%
Mortgage Type
Seller Take Back
Purchase Details
Closed on
Apr 16, 1998
Sold by
Edgell Sarah E
Bought by
Home Svgs Of America Fsb
Create a Home Valuation Report for This Property
The Home Valuation Report is an in-depth analysis detailing your home's value as well as a comparison with similar homes in the area
Home Values in the Area
Average Home Value in this Area
Purchase History
| Date | Buyer | Sale Price | Title Company |
|---|---|---|---|
| Delgadillo Jesus | -- | Timios Title A California Co | |
| Delgadillo Jesus | $134,000 | Investors Title Company | |
| Home Svgs Of America Fsb | $111,358 | Fidelity National Title |
Source: Public Records
Mortgage History
| Date | Status | Borrower | Loan Amount |
|---|---|---|---|
| Open | Delgadillo Jesus | $309,583 | |
| Closed | Delgadillo Jesus | $126,800 |
Source: Public Records
Tax History Compared to Growth
Tax History
| Year | Tax Paid | Tax Assessment Tax Assessment Total Assessment is a certain percentage of the fair market value that is determined by local assessors to be the total taxable value of land and additions on the property. | Land | Improvement |
|---|---|---|---|---|
| 2025 | $2,895 | $213,135 | $124,052 | $89,083 |
| 2024 | $2,895 | $208,957 | $121,620 | $87,337 |
| 2023 | $2,761 | $204,861 | $119,236 | $85,625 |
| 2022 | $2,776 | $200,846 | $116,899 | $83,947 |
| 2021 | $2,699 | $196,908 | $114,607 | $82,301 |
| 2019 | $2,624 | $191,069 | $111,208 | $79,861 |
| 2018 | $2,452 | $187,324 | $109,028 | $78,296 |
| 2016 | $2,233 | $180,052 | $104,796 | $75,256 |
| 2015 | $2,195 | $177,348 | $103,222 | $74,126 |
| 2014 | $2,186 | $173,875 | $101,201 | $72,674 |
Source: Public Records
Map
Nearby Homes
- 213 S Meadow Rd
- 2147 E Rio Verde Dr
- 1940 E Walnut Creek Pkwy
- 2249 E Rio Verde Dr
- 2407 E Walnut Creek Pkwy
- 235 S Azusa Ave
- 1715 E Mardina St
- 131 S Myrtlewood St
- 631 S Hillward Ave
- 1626 E Mardina St
- 577 S Albertson Ave
- 640 S Azusa Ave
- 401 S Cherrywood St
- 1536 E Norma Ave
- 1717 Cabrillo
- 501 Embrook Way
- 511 W Puente St Unit 1
- 1821 E Eckerman Ave
- 2551 E Larkwood St
- 708 N La Breda Ave
- 109 S Baymar St
- 117 S Baymar St
- 105 S Baymar St
- 121 S Baymar St
- 127 S Baymar St
- 114 S Baymar St
- 118 S Baymar St
- 106 S Baymar St
- 122 S Baymar St
- 131 S Baymar St
- 135 S Baymar St
- 2125 E James Ave
- 2116 E James Ave
- 2122 E James Ave
- 141 S Baymar St
- 2131 E James Ave
- 2126 E James Ave
- 2115 E Deodar Ave
- 145 S Baymar St
- 2137 E James Ave