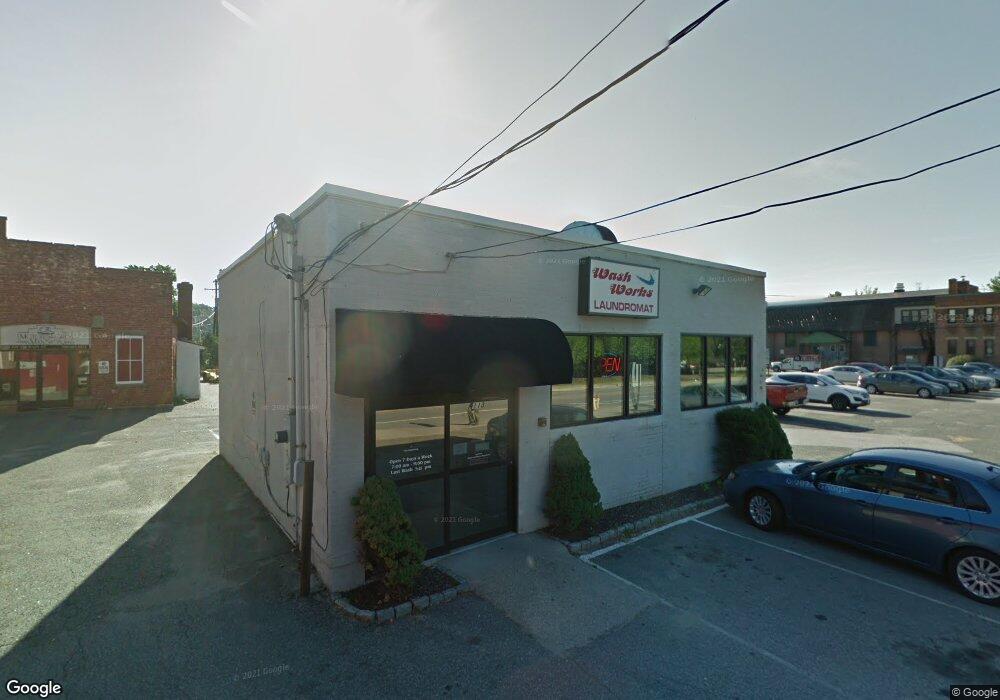
113 S Main St Torrington, CT 06790
Estimated Value: $267,768
Studio
--
Bath
918
Sq Ft
$292/Sq Ft
Est. Value
About This Home
This home is located at 113 S Main St, Torrington, CT 06790 and is currently estimated at $267,768, approximately $291 per square foot. 113 S Main St is a home located in Litchfield County with nearby schools including Torrington Middle School, Torrington High School, and Touchstone School.
Ownership History
Date
Name
Owned For
Owner Type
Purchase Details
Closed on
Mar 31, 2023
Sold by
Tabcompo Llc
Bought by
Beach Castles Llc
Current Estimated Value
Home Financials for this Owner
Home Financials are based on the most recent Mortgage that was taken out on this home.
Original Mortgage
$136,000
Outstanding Balance
$131,273
Interest Rate
6.32%
Mortgage Type
Purchase Money Mortgage
Estimated Equity
$136,495
Purchase Details
Closed on
Sep 10, 2003
Sold by
Hatten Family Lp
Bought by
Tabcompo Llc
Home Financials for this Owner
Home Financials are based on the most recent Mortgage that was taken out on this home.
Original Mortgage
$77,400
Interest Rate
6.75%
Mortgage Type
Commercial
Create a Home Valuation Report for This Property
The Home Valuation Report is an in-depth analysis detailing your home's value as well as a comparison with similar homes in the area
Home Values in the Area
Average Home Value in this Area
Purchase History
| Date | Buyer | Sale Price | Title Company |
|---|---|---|---|
| Beach Castles Llc | $205,000 | None Available | |
| Tabcompo Llc | $97,500 | -- |
Source: Public Records
Mortgage History
| Date | Status | Borrower | Loan Amount |
|---|---|---|---|
| Open | Beach Castles Llc | $136,000 | |
| Previous Owner | Tabcompo Llc | $77,400 | |
| Previous Owner | Tabcompo Llc | $110,000 |
Source: Public Records
Tax History
| Year | Tax Paid | Tax Assessment Tax Assessment Total Assessment is a certain percentage of the fair market value that is determined by local assessors to be the total taxable value of land and additions on the property. | Land | Improvement |
|---|---|---|---|---|
| 2025 | $4,745 | $123,410 | $44,800 | $78,610 |
| 2024 | $3,326 | $69,340 | $32,200 | $37,140 |
| 2023 | $3,326 | $69,340 | $32,200 | $37,140 |
| 2022 | $3,269 | $69,340 | $32,200 | $37,140 |
| 2021 | $3,201 | $69,340 | $32,200 | $37,140 |
| 2020 | $3,201 | $69,340 | $32,200 | $37,140 |
| 2019 | $3,121 | $67,600 | $30,800 | $36,800 |
| 2018 | $3,121 | $67,600 | $30,800 | $36,800 |
| 2017 | $3,093 | $67,600 | $30,800 | $36,800 |
| 2016 | $3,093 | $67,600 | $30,800 | $36,800 |
| 2015 | $3,093 | $67,600 | $30,800 | $36,800 |
| 2014 | $2,924 | $80,510 | $40,250 | $40,260 |
Source: Public Records
Map
Nearby Homes
Your Personal Tour Guide
Ask me questions while you tour the home.