Estimated Value: $329,000 - $424,000
--
Bed
--
Bath
2,310
Sq Ft
$163/Sq Ft
Est. Value
About This Home
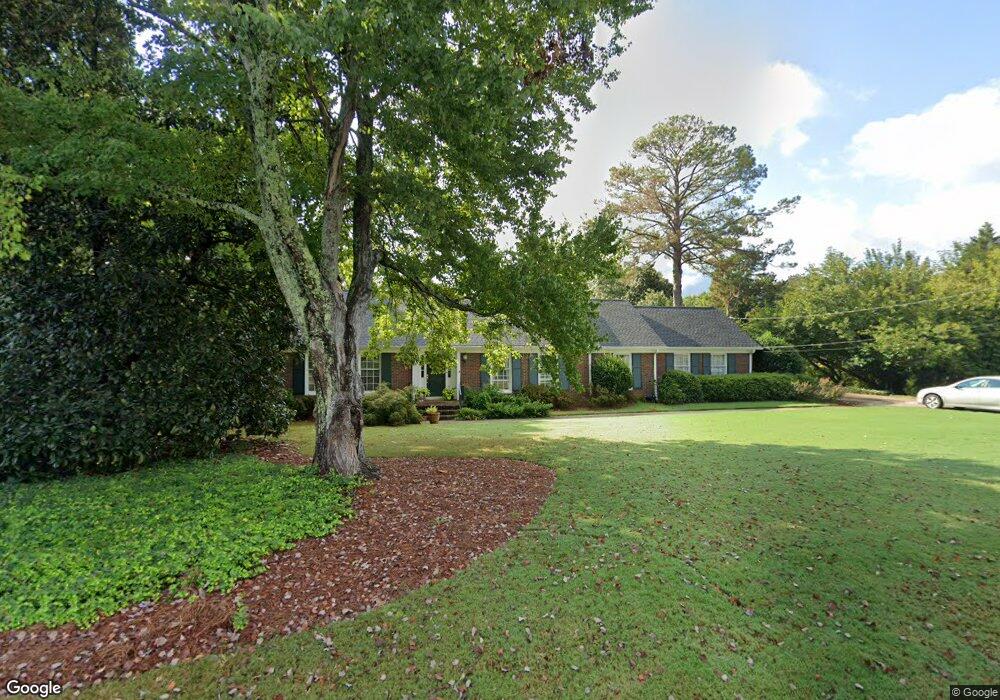
This home is located at 113 Saddle Mountain Rd SE, Rome, GA 30161 and is currently estimated at $375,439, approximately $162 per square foot. 113 Saddle Mountain Rd SE is a home located in Floyd County with nearby schools including Rome High School, Montessori School of Rome, and St. Mary School.
Ownership History
Date
Name
Owned For
Owner Type
Purchase Details
Closed on
Feb 20, 1992
Sold by
Bowman Bowman B and Bowman Donna
Bought by
Rowston William J and Rowston Virginia G
Current Estimated Value
Purchase Details
Closed on
Oct 9, 1987
Sold by
Gosser Marshall H Gosser Marshall H G
Bought by
Bowman Bowman B and Bowman Donna
Purchase Details
Closed on
Jul 13, 1984
Sold by
Donhahue Jessie Chaney Donhahue Jessie
Bought by
Gosser Marshall H Gosser Marshall H
Purchase Details
Closed on
May 4, 1983
Sold by
Donahue Cheney B Donahue Cheney B Dona
Bought by
Donhahue Jessie Chaney Donhahue Jes
Purchase Details
Closed on
Apr 5, 1971
Sold by
Jowers Alford E
Bought by
Donahue Cheney B Donahue Cheney B D
Purchase Details
Closed on
Jan 4, 1967
Sold by
Prestige Porperties Prestige Porperties
Bought by
P\R
Purchase Details
Closed on
Oct 18, 1965
Bought by
Prestige Porperties Prestige Porper
Create a Home Valuation Report for This Property
The Home Valuation Report is an in-depth analysis detailing your home's value as well as a comparison with similar homes in the area
Home Values in the Area
Average Home Value in this Area
Purchase History
| Date | Buyer | Sale Price | Title Company |
|---|---|---|---|
| Rowston William J | $155,000 | -- | |
| Bowman Bowman B | $110,000 | -- | |
| Gosser Marshall H Gosser Marshall H | $98,000 | -- | |
| Donhahue Jessie Chaney Donhahue Jes | -- | -- | |
| Donahue Cheney B Donahue Cheney B D | $25,300 | -- | |
| P\R | -- | -- | |
| Jowers Alford E | $1,100 | -- | |
| Prestige Porperties Prestige Porper | -- | -- |
Source: Public Records
Tax History Compared to Growth
Tax History
| Year | Tax Paid | Tax Assessment Tax Assessment Total Assessment is a certain percentage of the fair market value that is determined by local assessors to be the total taxable value of land and additions on the property. | Land | Improvement |
|---|---|---|---|---|
| 2024 | $2,544 | $118,949 | $25,171 | $93,778 |
| 2023 | $2,512 | $115,583 | $22,522 | $93,061 |
| 2022 | $2,891 | $96,575 | $18,547 | $78,028 |
| 2021 | $2,728 | $86,232 | $17,222 | $69,010 |
| 2020 | $2,671 | $81,623 | $13,248 | $68,375 |
| 2019 | $2,473 | $71,576 | $13,248 | $58,328 |
| 2018 | $2,384 | $66,381 | $13,248 | $53,133 |
| 2017 | $2,341 | $64,516 | $13,248 | $51,268 |
| 2016 | $2,464 | $70,460 | $13,240 | $57,220 |
| 2015 | $2,250 | $67,300 | $13,240 | $54,060 |
| 2014 | $2,250 | $65,668 | $13,240 | $52,428 |
Source: Public Records
Map
Nearby Homes
- 36 Saddle Mountain Rd SE
- 211 Alfred Ave SE
- 212 Alfred Ave SE
- 226 Flora Ave SE
- 2812 Maple Rd SE
- 27 Saddle Mountain Rd SE
- 2710 Maple Rd SE
- 409 Flora Ave SE
- 2523 Maple Rd SE
- 3 Belmont Ct SE
- 15 Saddlebrook Dr SE
- 3014 Maple Rd SE
- 2508 Maple Rd SE
- 2501 Maple Rd SE
- 26 Saddlebrook Dr SE
- 109 Chateau Dr SE
- 105 Chateau Dr SE
- 121 Holly St SE
- 36 Coventry Dr SE
- 22 Coventry Dr SE
- 111 Saddle Mountain Rd SE
- 115 Saddle Mountain Rd SE
- 110 Saddle Mountain Rd SE
- 112 Saddle Mountain Rd SE
- 114 Saddle Mountain Rd SE
- 108 Saddle Mountain Rd SE
- 109 Saddle Mountain Rd SE
- 117 Saddle Mountain Rd SE
- 106 Saddle Mountain Rd SE
- 116 Saddle Mountain Rd SE
- 107 Saddle Mountain Rd SE
- 119 Saddle Mountain Rd SE
- 16 Quail Hollow SE
- 104 Saddle Mountain Rd SE
- 9 Quail Hollow SE
- 118 Saddle Mountain Rd SE
- 5 Wren Place SE
- 105 Saddle Mountain Rd SE
- 102 Saddle Mountain Rd SE
- 121 Saddle Mountain Rd SE