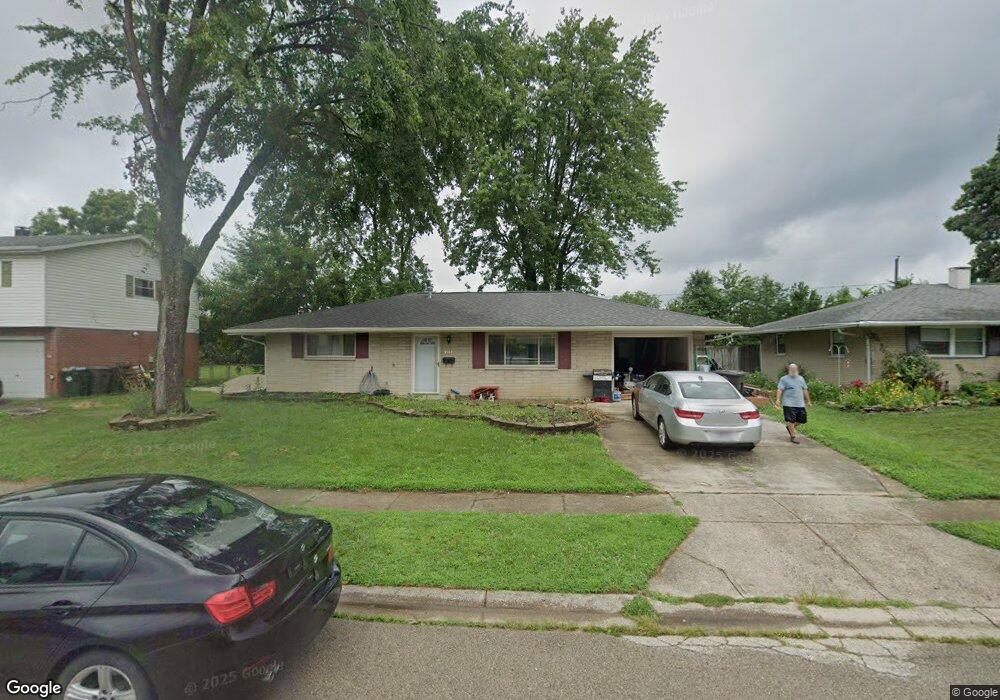
113 Savoy Ave Dayton, OH 45449
Estimated Value: $168,000 - $183,000
3
Beds
2
Baths
959
Sq Ft
$182/Sq Ft
Est. Value
About This Home
This home is located at 113 Savoy Ave, Dayton, OH 45449 and is currently estimated at $174,944, approximately $182 per square foot. 113 Savoy Ave is a home located in Montgomery County with nearby schools including West Carrollton High School, Miami Valley Academies, and Bishop Leibold School.
Ownership History
Date
Name
Owned For
Owner Type
Purchase Details
Closed on
Nov 18, 2021
Sold by
Shell Brian E
Bought by
Miller Joziah
Current Estimated Value
Home Financials for this Owner
Home Financials are based on the most recent Mortgage that was taken out on this home.
Original Mortgage
$122,735
Outstanding Balance
$112,698
Interest Rate
3.14%
Mortgage Type
FHA
Estimated Equity
$62,246
Purchase Details
Closed on
Feb 25, 2000
Sold by
Ballard Tommy
Bought by
Shell Brian E
Home Financials for this Owner
Home Financials are based on the most recent Mortgage that was taken out on this home.
Original Mortgage
$83,457
Interest Rate
8.27%
Mortgage Type
FHA
Purchase Details
Closed on
Sep 24, 1999
Sold by
Concept Enterprises Inc
Bought by
Ballard Tommy
Purchase Details
Closed on
Jun 18, 1999
Sold by
Arthur Bussard Blair
Bought by
Concept Enterprises Inc
Create a Home Valuation Report for This Property
The Home Valuation Report is an in-depth analysis detailing your home's value as well as a comparison with similar homes in the area
Home Values in the Area
Average Home Value in this Area
Purchase History
| Date | Buyer | Sale Price | Title Company |
|---|---|---|---|
| Miller Joziah | $125,000 | Vantage Land Title | |
| Shell Brian E | $83,500 | -- | |
| Ballard Tommy | $56,700 | -- | |
| Concept Enterprises Inc | $34,800 | -- | |
| Bussard Blair Arthur | -- | -- |
Source: Public Records
Mortgage History
| Date | Status | Borrower | Loan Amount |
|---|---|---|---|
| Open | Miller Joziah | $122,735 | |
| Previous Owner | Shell Brian E | $83,457 |
Source: Public Records
Tax History Compared to Growth
Tax History
| Year | Tax Paid | Tax Assessment Tax Assessment Total Assessment is a certain percentage of the fair market value that is determined by local assessors to be the total taxable value of land and additions on the property. | Land | Improvement |
|---|---|---|---|---|
| 2024 | $2,618 | $42,880 | $10,050 | $32,830 |
| 2023 | $2,618 | $42,880 | $10,050 | $32,830 |
| 2022 | $2,275 | $29,170 | $6,840 | $22,330 |
| 2021 | $2,279 | $29,170 | $6,840 | $22,330 |
| 2020 | $2,280 | $29,170 | $6,840 | $22,330 |
| 2019 | $2,072 | $24,440 | $5,930 | $18,510 |
| 2018 | $1,941 | $24,440 | $5,930 | $18,510 |
| 2017 | $1,927 | $24,440 | $5,930 | $18,510 |
| 2016 | $1,970 | $24,410 | $5,930 | $18,480 |
| 2015 | $1,810 | $24,410 | $5,930 | $18,480 |
| 2014 | $1,810 | $24,410 | $5,930 | $18,480 |
| 2012 | -- | $31,620 | $7,540 | $24,080 |
Source: Public Records
Map
Nearby Homes
- 2 Savoy Ave
- 509 Windsor Ave
- 137 E Central Ave
- 305 E Central Ave
- 201 S Smith St
- 12 E Main St
- 341 E Central Ave
- 322 E Main St
- 21 W Main St
- 518 Regal Ave
- 949 Primrose Dr
- 109 Cedar St
- 209 E Cottage Ave
- 428 E Cottage Ave
- 333 E Cottage Ave
- 434 E Cottage Ave
- 133 E Circle Dr
- 428 Burns Ave
- 706 Cherry Blossom Dr
- 275 Orchard Hill Dr