Estimated Value: $152,000 - $174,000
3
Beds
2
Baths
1,456
Sq Ft
$110/Sq Ft
Est. Value
About This Home
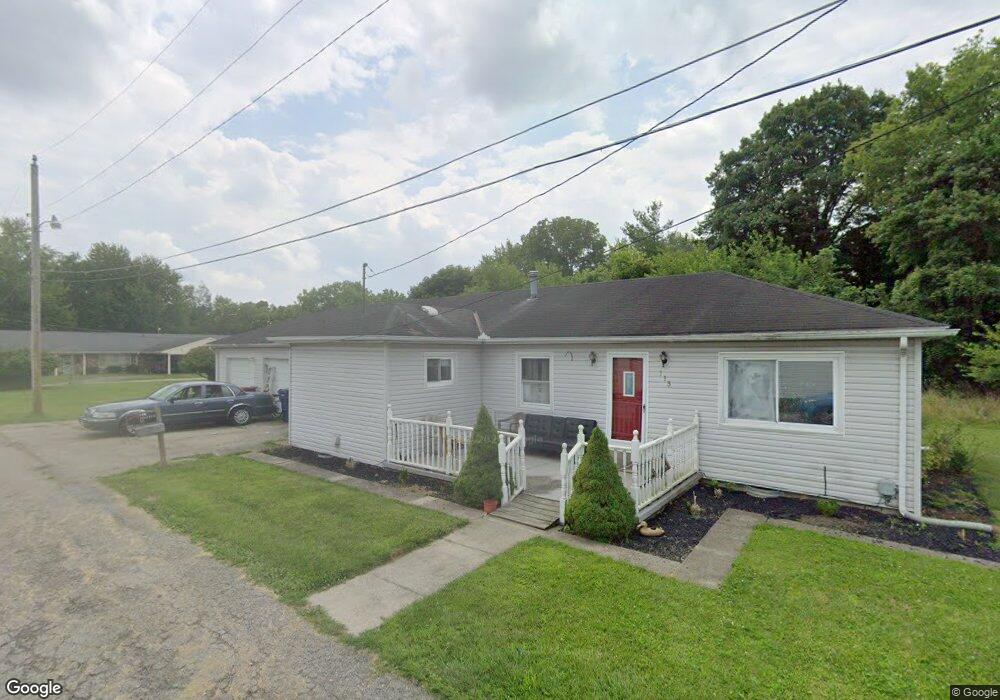
This home is located at 113 Sherman St, Piqua, OH 45356 and is currently estimated at $160,551, approximately $110 per square foot. 113 Sherman St is a home located in Miami County with nearby schools including Washington Primary School, Piqua Junior High School, and Piqua High School.
Ownership History
Date
Name
Owned For
Owner Type
Purchase Details
Closed on
Apr 9, 2013
Sold by
Secretary Of Housing & Urban Development
Bought by
Albers Daniel L and Albers Bowanna M
Current Estimated Value
Purchase Details
Closed on
Jan 8, 2013
Sold by
Yantis Richard F
Bought by
Fifth Third Mortgage Company
Purchase Details
Closed on
Dec 26, 2012
Sold by
Fifth Third Mortgage Company
Bought by
Secretary Of The Us Deparment Of Housing
Purchase Details
Closed on
Nov 29, 2012
Sold by
Yantis Richard F and Yantis Mona Lee
Bought by
Fifth Third Mortgage Company
Purchase Details
Closed on
Apr 22, 2008
Sold by
Slover Teresa C Beougher
Bought by
Yantis Richard F and Yantis Mona Lee
Purchase Details
Closed on
Jun 1, 1988
Bought by
Beougher Teresa
Create a Home Valuation Report for This Property
The Home Valuation Report is an in-depth analysis detailing your home's value as well as a comparison with similar homes in the area
Home Values in the Area
Average Home Value in this Area
Purchase History
| Date | Buyer | Sale Price | Title Company |
|---|---|---|---|
| Albers Daniel L | $56,000 | Attorney | |
| Fifth Third Mortgage Company | $50,000 | Attorney | |
| Secretary Of The Us Deparment Of Housing | -- | Attorney | |
| Fifth Third Mortgage Company | $50,000 | Attorney | |
| Yantis Richard F | $81,000 | -- | |
| Beougher Teresa | $35,000 | -- |
Source: Public Records
Mortgage History
| Date | Status | Borrower | Loan Amount |
|---|---|---|---|
| Closed | Yantis Richard F | $0 |
Source: Public Records
Tax History Compared to Growth
Tax History
| Year | Tax Paid | Tax Assessment Tax Assessment Total Assessment is a certain percentage of the fair market value that is determined by local assessors to be the total taxable value of land and additions on the property. | Land | Improvement |
|---|---|---|---|---|
| 2024 | $1,430 | $33,920 | $7,880 | $26,040 |
| 2023 | $1,430 | $33,920 | $7,880 | $26,040 |
| 2022 | $1,455 | $33,920 | $7,880 | $26,040 |
| 2021 | $1,219 | $26,080 | $6,060 | $20,020 |
| 2020 | $1,199 | $26,080 | $6,060 | $20,020 |
| 2019 | $1,205 | $26,080 | $6,060 | $20,020 |
| 2018 | $1,137 | $23,450 | $6,090 | $17,360 |
| 2017 | $1,151 | $23,450 | $6,090 | $17,360 |
| 2016 | $1,139 | $23,450 | $6,090 | $17,360 |
| 2015 | $1,121 | $22,550 | $5,850 | $16,700 |
| 2014 | $1,121 | $22,550 | $5,850 | $16,700 |
| 2013 | $1,125 | $22,550 | $5,850 | $16,700 |
Source: Public Records
Map
Nearby Homes
- 114 Cassell St
- 112 Cassell St
- 1129 W Water St
- 1125 W Water St
- 1137 W Water St
- 114 Sherman St
- 106 Cassell St
- 1121 W Water St
- 116 Sherman St
- 108 Sherman St
- 108 Sherman St
- 108 Sherman St
- 108 Sherman St
- 108 Sherman St
- 108 Sherman St
- 108 Sherman St
- 104 Cassell St
- 1115 W Water St
- 118 Sherman St
- 120 Sherman St