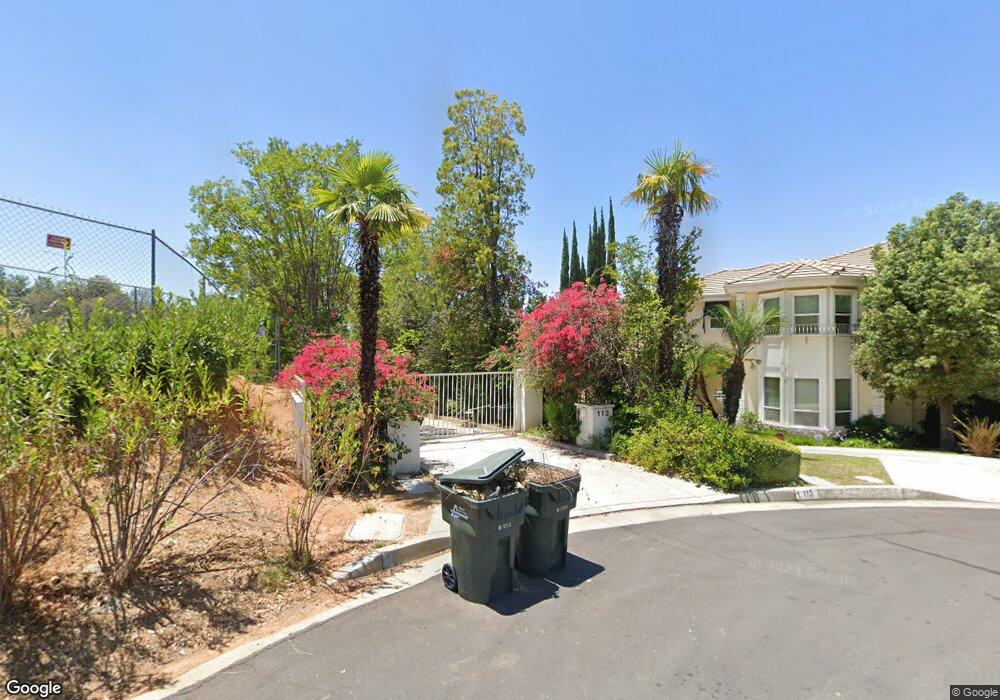
113 Sutter Creek Monrovia, CA 91016
Estimated Value: $2,597,412 - $3,516,000
5
Beds
6
Baths
5,400
Sq Ft
$533/Sq Ft
Est. Value
About This Home
This home is located at 113 Sutter Creek, Monrovia, CA 91016 and is currently estimated at $2,876,603, approximately $532 per square foot. 113 Sutter Creek is a home located in Los Angeles County with nearby schools including Mayflower Elementary School, Clifton Middle School, and Monrovia High School.
Ownership History
Date
Name
Owned For
Owner Type
Purchase Details
Closed on
May 20, 2010
Sold by
Cho Sung Sang and Cho Kye Young
Bought by
Lim Kwang Soo
Current Estimated Value
Purchase Details
Closed on
Dec 27, 2004
Sold by
Danoon Investment Co Inc
Bought by
Cno Sung Sang and Cho Kye Young
Purchase Details
Closed on
Jun 25, 2004
Sold by
Chew George K and Greenberg Vickie S
Bought by
Dahoon Investment Co Inc
Purchase Details
Closed on
Sep 26, 2002
Sold by
Johnston Clyde J and Johnston Toni V
Bought by
Chew George K and Greenberg Vickie S
Home Financials for this Owner
Home Financials are based on the most recent Mortgage that was taken out on this home.
Original Mortgage
$750,000
Interest Rate
6.09%
Purchase Details
Closed on
Dec 21, 2000
Sold by
Adelman Ben and Adelman Helene
Bought by
Johnston Clyde J and Johnston Toni V
Home Financials for this Owner
Home Financials are based on the most recent Mortgage that was taken out on this home.
Original Mortgage
$840,000
Interest Rate
7.54%
Create a Home Valuation Report for This Property
The Home Valuation Report is an in-depth analysis detailing your home's value as well as a comparison with similar homes in the area
Home Values in the Area
Average Home Value in this Area
Purchase History
| Date | Buyer | Sale Price | Title Company |
|---|---|---|---|
| Lim Kwang Soo | $1,260,000 | Fatcola | |
| Cno Sung Sang | $1,700,000 | -- | |
| Dahoon Investment Co Inc | $1,700,000 | Southland Title | |
| Chew George K | $1,400,000 | Southland Title Corporation | |
| Johnston Clyde J | $1,200,000 | Southland Title |
Source: Public Records
Mortgage History
| Date | Status | Borrower | Loan Amount |
|---|---|---|---|
| Previous Owner | Chew George K | $750,000 | |
| Previous Owner | Johnston Clyde J | $840,000 | |
| Closed | Chew George K | $500,000 |
Source: Public Records
Tax History
| Year | Tax Paid | Tax Assessment Tax Assessment Total Assessment is a certain percentage of the fair market value that is determined by local assessors to be the total taxable value of land and additions on the property. | Land | Improvement |
|---|---|---|---|---|
| 2025 | $21,600 | $1,626,422 | $1,026,456 | $599,966 |
| 2024 | $21,600 | $1,594,532 | $1,006,330 | $588,202 |
| 2023 | $21,109 | $1,563,268 | $986,599 | $576,669 |
| 2022 | $20,497 | $1,532,616 | $967,254 | $565,362 |
| 2021 | $20,088 | $1,502,566 | $948,289 | $554,277 |
| 2019 | $19,121 | $1,458,001 | $920,163 | $537,838 |
| 2018 | $18,554 | $1,429,414 | $902,121 | $527,293 |
| 2016 | $17,819 | $1,373,910 | $867,092 | $506,818 |
| 2015 | $17,428 | $1,353,274 | $854,068 | $499,206 |
| 2014 | $17,247 | $1,326,766 | $837,338 | $489,428 |
Source: Public Records
Map
Nearby Homes
- 34 Hidden Valley Rd
- 1069 Briarcliff Rd
- 1091 Briarcliff Rd
- 976 Ridgeside Dr
- 425 N Canyon Blvd
- 426 N Canyon Blvd
- 245 W Scenic Dr
- 375 N Canyon Blvd
- 347 Stedman Place
- 537 Cloverleaf Dr
- 376 Hill St
- 319 N Encinitas Ave
- 143 W Greystone Ave
- 210 N Encinitas Ave
- 633 Norumbega Dr
- 228 Oaks Ave
- 341 Norumbega Dr
- 137 N Myrtle Ave
- 248 Poppy Ave
- 128 N Ivy Ave
- 109 Sutter Creek
- 108 Oak Grove
- 0 Sutter Creek Unit WS18150000
- 0 Sutter Creek Unit WS22238114
- 0 Sutter Creek Unit WS22051821
- 0 Sutter Creek Unit WS19276530
- 105 Oak Grove
- 105 Oak Grove
- 105 Sutter Creek
- 109 Oak Grove
- 109 Oak Grove
- 572 N Alta Vista Ave
- 101 Oak Grove
- 101 Oak Grove
- 1024 Briarcliff Rd
- 1022 Briarcliff Rd
- 558 N Alta Vista Ave
- 598 N Alta Vista Ave
- 101 Sutter Creek
- 1026 Briarcliff Rd
Your Personal Tour Guide
Ask me questions while you tour the home.