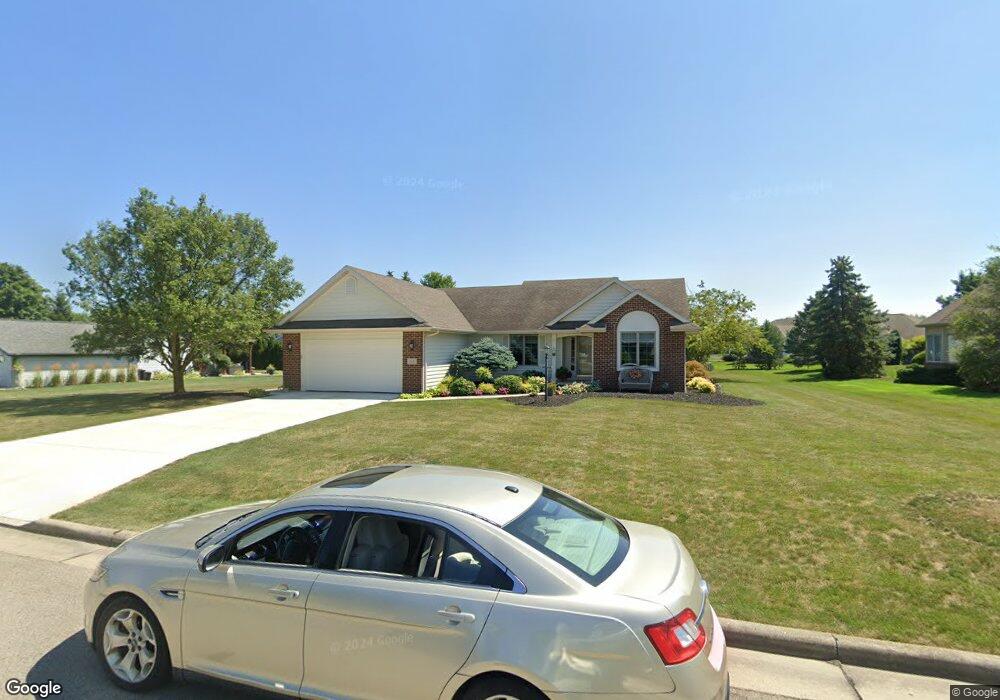
113 Sylvanus St Archbold, OH 43502
Estimated Value: $270,380 - $288,000
3
Beds
2
Baths
1,727
Sq Ft
$161/Sq Ft
Est. Value
About This Home
This home is located at 113 Sylvanus St, Archbold, OH 43502 and is currently estimated at $277,345, approximately $160 per square foot. 113 Sylvanus St is a home located in Fulton County with nearby schools including Archbold Elementary School, Archbold Middle School, and Archbold High School.
Ownership History
Date
Name
Owned For
Owner Type
Purchase Details
Closed on
Jan 14, 2012
Sold by
Nafziger Sara J
Bought by
Nafziger Douglas A and Nafziger Michele L
Current Estimated Value
Purchase Details
Closed on
Apr 28, 2003
Sold by
Harry Yoder Construction Inc
Bought by
Nafziger Richard L and Nafziger Sara J
Purchase Details
Closed on
Jan 1, 1990
Bought by
Lugbill Brothers Inc
Create a Home Valuation Report for This Property
The Home Valuation Report is an in-depth analysis detailing your home's value as well as a comparison with similar homes in the area
Home Values in the Area
Average Home Value in this Area
Purchase History
| Date | Buyer | Sale Price | Title Company |
|---|---|---|---|
| Nafziger Douglas A | -- | Attorney | |
| Nafziger Richard L | -- | -- | |
| Lugbill Brothers Inc | -- | -- |
Source: Public Records
Tax History
| Year | Tax Paid | Tax Assessment Tax Assessment Total Assessment is a certain percentage of the fair market value that is determined by local assessors to be the total taxable value of land and additions on the property. | Land | Improvement |
|---|---|---|---|---|
| 2024 | $3,904 | $86,420 | $13,510 | $72,910 |
| 2023 | $3,959 | $86,420 | $13,510 | $72,910 |
| 2022 | $3,088 | $72,030 | $11,270 | $60,760 |
| 2021 | $3,092 | $72,030 | $11,270 | $60,760 |
| 2020 | $3,077 | $72,030 | $11,270 | $60,760 |
| 2019 | $2,601 | $59,780 | $11,270 | $48,510 |
| 2018 | $2,413 | $59,780 | $11,270 | $48,510 |
| 2017 | $2,346 | $59,780 | $11,270 | $48,510 |
| 2016 | $2,477 | $59,780 | $11,270 | $48,510 |
| 2015 | $2,170 | $59,780 | $11,270 | $48,510 |
| 2014 | $4,042 | $59,780 | $11,270 | $48,510 |
| 2013 | $4,400 | $57,510 | $9,560 | $47,950 |
Source: Public Records
Map
Nearby Homes
- 202 Short-Buehrer Rd
- 226 Burke St
- 0 Lafayette St
- 808 West St
- 224 Hawthorn Dr
- 408 Ditto St
- 301 N Pointe Dr
- 433 Primrose Ln
- 552 Quail Run
- 21530 County Road A
- V-526 Co Rd 25
- 4427 County Road 19
- 285 Cherry St
- 302 Tyler Ln
- 200 Tyler Ln
- 17830 County Road C
- 301 Horton St
- 18857 U S 20a
- 20095 County Road H50
- 22227 Us Highway 20a
- 109 Sylvanus St
- 300 Lawrence Ln
- 324 Short Buehrer Rd
- 328 Short Buehrer Rd
- 116 Sylvanus St
- 105 Sylvanus St
- 0 Lawrence Ln
- 120 Sylvanus St
- 108 Sylvanus St
- 301 Lawrence Ln
- 101 Sylvanus St
- 408 Short-Buehrer Rd
- 0 Rd
- 303 Lawrence Ln
- 316 Short Buehrer Rd
- 200 Sylvanus St
- 313 Short Buehrer Rd
- 321 Short Buehrer Rd
- 104 Sylvanus St
- 205 Sylvanus St
Your Personal Tour Guide
Ask me questions while you tour the home.