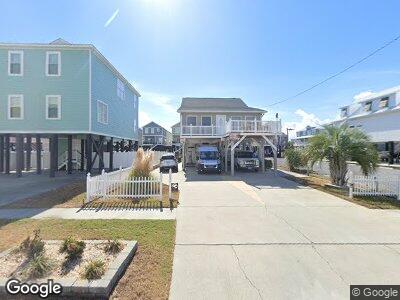
113 Yaupon Ave Unit "Steel Working" Murrells Inlet, SC 29576
Estimated Value: $862,000 - $919,000
4
Beds
3
Baths
2,254
Sq Ft
$395/Sq Ft
Est. Value
About This Home
This home is located at 113 Yaupon Ave Unit "Steel Working", Murrells Inlet, SC 29576 and is currently estimated at $889,415, approximately $394 per square foot. 113 Yaupon Ave Unit "Steel Working" is a home located in Horry County with nearby schools including Seaside Elementary, St. James Middle School, and St. James Intermediate.
Ownership History
Date
Name
Owned For
Owner Type
Purchase Details
Closed on
Mar 29, 2023
Sold by
Helgans Thomas
Bought by
Mound Road Leasing Co Llc
Current Estimated Value
Purchase Details
Closed on
Jul 1, 2015
Sold by
Chasteen Kathy P
Bought by
Helgans Thomas A and Helgans Jennifer V
Home Financials for this Owner
Home Financials are based on the most recent Mortgage that was taken out on this home.
Original Mortgage
$180,000
Interest Rate
3.92%
Mortgage Type
Future Advance Clause Open End Mortgage
Purchase Details
Closed on
Jun 26, 2000
Sold by
Green Robert Henry and Green Elizabeth
Bought by
Chasteen Kathy P
Home Financials for this Owner
Home Financials are based on the most recent Mortgage that was taken out on this home.
Original Mortgage
$250,000
Interest Rate
8.63%
Mortgage Type
Purchase Money Mortgage
Create a Home Valuation Report for This Property
The Home Valuation Report is an in-depth analysis detailing your home's value as well as a comparison with similar homes in the area
Home Values in the Area
Average Home Value in this Area
Purchase History
| Date | Buyer | Sale Price | Title Company |
|---|---|---|---|
| Mound Road Leasing Co Llc | $825,000 | -- | |
| Helgans Thomas A | $335,000 | -- | |
| Chasteen Kathy P | $280,000 | -- |
Source: Public Records
Mortgage History
| Date | Status | Borrower | Loan Amount |
|---|---|---|---|
| Previous Owner | Helgans Thomas | $307,000 | |
| Previous Owner | Helgans Thomas | $266,000 | |
| Previous Owner | Helgans Thomas A | $180,000 | |
| Previous Owner | Chasteen Kathy P | $252,800 | |
| Previous Owner | Chasteen Kathy P | $250,000 | |
| Previous Owner | Green Robert H | $97,000 |
Source: Public Records
Tax History Compared to Growth
Tax History
| Year | Tax Paid | Tax Assessment Tax Assessment Total Assessment is a certain percentage of the fair market value that is determined by local assessors to be the total taxable value of land and additions on the property. | Land | Improvement |
|---|---|---|---|---|
| 2024 | -- | $16,692 | $8,772 | $7,920 |
| 2023 | $1,690 | $16,692 | $8,772 | $7,920 |
| 2021 | $1,523 | $20,230 | $11,482 | $8,748 |
| 2020 | $1,272 | $18,810 | $11,482 | $7,328 |
| 2019 | $1,272 | $18,810 | $11,482 | $7,328 |
| 2018 | $0 | $13,280 | $7,628 | $5,652 |
| 2017 | $1,124 | $13,280 | $7,628 | $5,652 |
| 2016 | -- | $13,280 | $7,628 | $5,652 |
| 2015 | $4,123 | $19,920 | $11,442 | $8,478 |
| 2014 | $4,075 | $20,820 | $12,342 | $8,478 |
Source: Public Records
Map
Nearby Homes
- 301 N Waccamaw Dr Unit 110
- 301 N Waccamaw Dr Unit 209
- 301 N Waccamaw Dr Unit 109
- 301 N Waccamaw Dr Unit 211 GARDEN SANDS
- 301 N Waccamaw Dr Unit 206
- 125 Garden City Retreat Dr Unit 7 The Retreat @ Gard
- 200 N Waccamaw Dr Unit 3F
- 120 Dogwood Dr N Unit 209
- 120 Dogwood Dr N Unit 314 Garden City Gues
- 120 Dogwood Dr N Unit 313 Garden City Gues
- 120 Dogwood Dr N Unit 113
- 225 Dogwood Dr N
- 209 Dogwood Dr N Unit "Cottage on the Mars
- 132 N Waccamaw Dr
- 126 N Waccamaw Dr Unit 101
- 400 N Waccamaw Dr Unit 304
- 410 N Waccamaw Dr Unit 306 Sea Mystique
- 100 N Waccamaw Dr
- 116 S Waccamaw Dr Unit 205 Duneside III
- 116 S Waccamaw Dr Unit 204 Duneside III
- 113 Yaupon Ave Unit "Steel Working"
- 113 Yaupon Ave
- 105 Yaupon Ave
- 221 N Waccamaw Dr
- 221 N Waccamaw Dr Unit "Awesome Views"
- 101 Yaupon Ave
- 117 Garden City Retreat Dr Unit N. Waccamaw Dr. & Ma
- 12 Gc Retreat Dr
- 215 N Waccamaw Dr
- 124 Garden City Retreat Dr Unit N. Waccamaw Dr. & Ma
- 124 Garden City Retreat Dr
- 124 Garden City Retreat Dr Unit Lot 8
- 123 Yaupon Ave
- 164 Garden City Retreat Dr
- 148 Garden City Retreat Dr Unit LOT 12 Retreat Garde
- 116 Yaupon Ave
- 301 N Waccamaw Dr Unit 306 Garden Sands
- 301 N Waccamaw Dr Unit 310 Garden Sands
- 301 N Waccamaw Dr Unit 107 Gardens Sands
- 301 N Waccamaw Dr Unit 204 Garden Sands