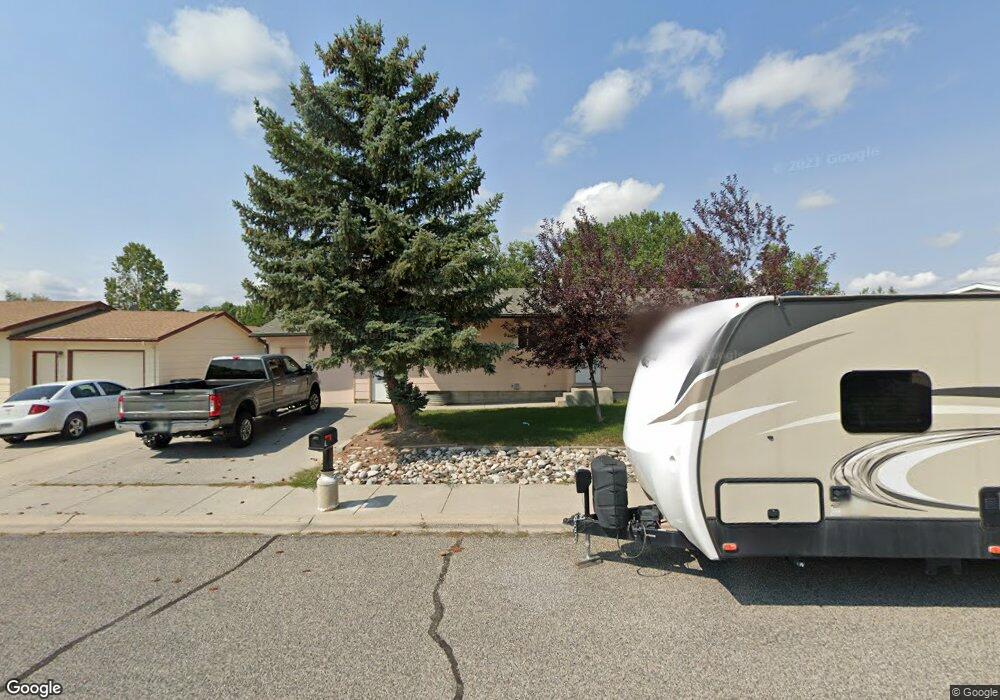
1130 13th Ave Laurel, MT 59044
Estimated Value: $321,000 - $370,000
3
Beds
2
Baths
1,050
Sq Ft
$327/Sq Ft
Est. Value
About This Home
This home is located at 1130 13th Ave, Laurel, MT 59044 and is currently estimated at $343,425, approximately $327 per square foot. 1130 13th Ave is a home located in Yellowstone County with nearby schools including West School, Fred W. Graff School, and Laurel Middle School.
Ownership History
Date
Name
Owned For
Owner Type
Purchase Details
Closed on
Dec 12, 2018
Sold by
Langve Stanley J and Langve Millissa D
Bought by
Us Bank Na
Current Estimated Value
Purchase Details
Closed on
Jun 18, 2014
Sold by
Langue Millissa D
Bought by
Langue Stanley J
Purchase Details
Closed on
Apr 24, 2012
Sold by
Langve Stanley J
Bought by
Langve Stanley J and Langve Millissa D
Home Financials for this Owner
Home Financials are based on the most recent Mortgage that was taken out on this home.
Original Mortgage
$116,000
Interest Rate
3.9%
Mortgage Type
New Conventional
Purchase Details
Closed on
Feb 8, 2005
Sold by
Langve Nanette M
Bought by
Langve Stanley J
Create a Home Valuation Report for This Property
The Home Valuation Report is an in-depth analysis detailing your home's value as well as a comparison with similar homes in the area
Home Values in the Area
Average Home Value in this Area
Purchase History
| Date | Buyer | Sale Price | Title Company |
|---|---|---|---|
| Us Bank Na | $30,000 | -- | |
| Langue Stanley J | -- | None Available | |
| Langve Stanley J | -- | St | |
| Langve Stanley J | -- | None Available |
Source: Public Records
Mortgage History
| Date | Status | Borrower | Loan Amount |
|---|---|---|---|
| Previous Owner | Langve Stanley J | $116,000 |
Source: Public Records
Tax History
| Year | Tax Paid | Tax Assessment Tax Assessment Total Assessment is a certain percentage of the fair market value that is determined by local assessors to be the total taxable value of land and additions on the property. | Land | Improvement |
|---|---|---|---|---|
| 2025 | $2,704 | $344,100 | $79,147 | $264,953 |
| 2024 | $2,704 | $273,400 | $72,687 | $200,713 |
| 2023 | $2,494 | $273,400 | $72,687 | $200,713 |
| 2022 | $2,295 | $239,400 | $0 | $0 |
| 2021 | $2,314 | $239,400 | $0 | $0 |
| 2020 | $2,235 | $226,900 | $0 | $0 |
| 2019 | $2,219 | $226,900 | $0 | $0 |
| 2018 | $2,048 | $198,400 | $0 | $0 |
| 2017 | $1,689 | $198,400 | $0 | $0 |
| 2016 | $1,829 | $191,900 | $0 | $0 |
| 2015 | $1,807 | $191,900 | $0 | $0 |
| 2014 | $1,605 | $88,457 | $0 | $0 |
Source: Public Records
Map
Nearby Homes
- 1014 Rochelle Ln
- 1109 10th Ave
- TBD Block 3 Lot 6
- 1216 W 12th Street Cir
- 1254 W Beartooth Dr
- 1712 Paynes Place
- 310 (and 814 w 4) 8th Ave
- 603 5th Ave
- 1319 Valley Dr
- 319 6th Ave
- 1735 Lobo Dr
- 102 8th Ave Unit B
- 1631 Valley Dr
- 116 4th Ave
- 110 E 5th St
- 1960 Coyote Ridge Rd N
- 516 Pennsylvania Ave
- 120 Forrest Ave
- 208 West Ave
- 414 Wyoming Ave
- 1124 13th Ave
- 1302 W 12th St
- 1115 Cherry Hills Dr
- 1119 Cherry Hills Dr
- 1118 13th Ave
- 1121 Cherry Hills Dr
- 1113 Cherry Hills Dr
- 1131 13th Ave
- 1125 13th Ave
- 1117 Cherry Hills Dr
- 1111 Cherry Hills Dr
- 1112 13th Ave
- 1119 13th Ave
- 1113 13th Ave
- 1106 13th Ave
- 1130 12th Ave
- 1130 12th Ave Unit Laurel
- 1118 Cherry Hills Dr
- 1136 12th Ave
- 1124 12th Ave
Your Personal Tour Guide
Ask me questions while you tour the home.