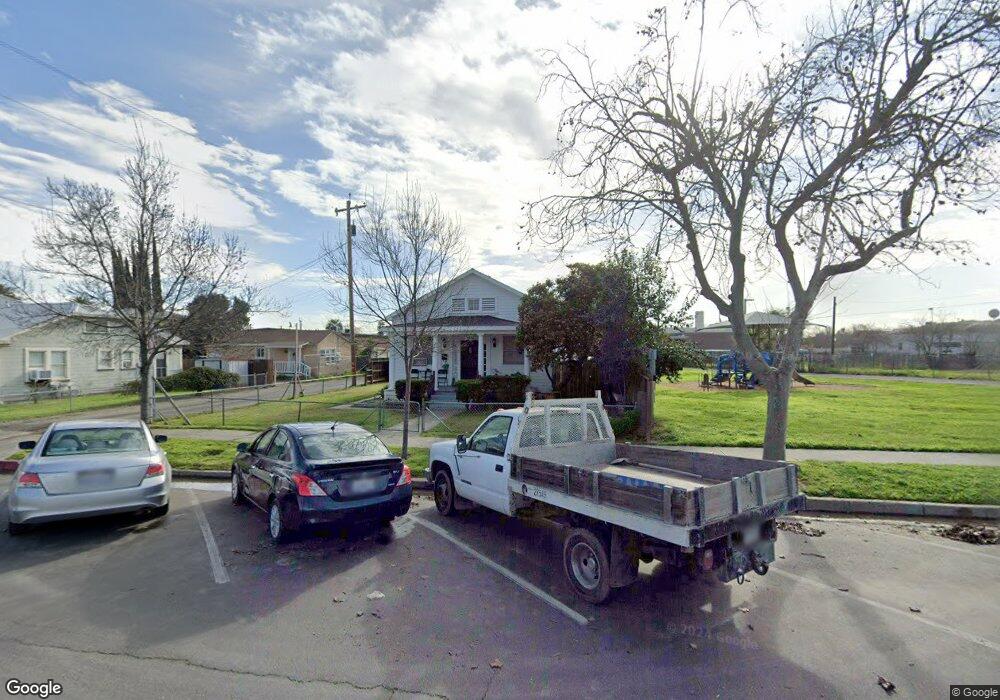
1130 5th St Los Banos, CA 93635
Estimated Value: $356,000 - $376,146
2
Beds
1
Bath
1,560
Sq Ft
$235/Sq Ft
Est. Value
About This Home
This home is located at 1130 5th St, Los Banos, CA 93635 and is currently estimated at $367,287, approximately $235 per square foot. 1130 5th St is a home located in Merced County with nearby schools including Los Banos Elementary School, Creekside Junior High School, and Los Banos High School.
Ownership History
Date
Name
Owned For
Owner Type
Purchase Details
Closed on
Feb 3, 2005
Sold by
Haight Barbara and Mederios Evelyn
Bought by
Gutierez Fabian B and Gutierez Victoria
Current Estimated Value
Home Financials for this Owner
Home Financials are based on the most recent Mortgage that was taken out on this home.
Original Mortgage
$160,000
Outstanding Balance
$85,039
Interest Rate
6.45%
Mortgage Type
Purchase Money Mortgage
Estimated Equity
$282,248
Create a Home Valuation Report for This Property
The Home Valuation Report is an in-depth analysis detailing your home's value as well as a comparison with similar homes in the area
Home Values in the Area
Average Home Value in this Area
Purchase History
| Date | Buyer | Sale Price | Title Company |
|---|---|---|---|
| Gutierez Fabian B | $200,000 | Fidelity National Title Comp |
Source: Public Records
Mortgage History
| Date | Status | Borrower | Loan Amount |
|---|---|---|---|
| Open | Gutierez Fabian B | $160,000 | |
| Closed | Gutierez Fabian B | $40,000 |
Source: Public Records
Tax History
| Year | Tax Paid | Tax Assessment Tax Assessment Total Assessment is a certain percentage of the fair market value that is determined by local assessors to be the total taxable value of land and additions on the property. | Land | Improvement |
|---|---|---|---|---|
| 2025 | $3,139 | $283,824 | $118,475 | $165,349 |
| 2024 | $3,139 | $278,259 | $116,152 | $162,107 |
| 2023 | $2,965 | $272,804 | $113,875 | $158,929 |
| 2022 | $2,922 | $267,456 | $111,643 | $155,813 |
| 2021 | $2,895 | $262,212 | $109,454 | $152,758 |
| 2020 | $2,863 | $259,524 | $108,332 | $151,192 |
| 2019 | $2,813 | $254,436 | $106,208 | $148,228 |
| 2018 | $2,730 | $249,448 | $104,126 | $145,322 |
| 2017 | $2,698 | $244,558 | $102,085 | $142,473 |
| 2016 | $2,730 | $239,764 | $100,084 | $139,680 |
| 2015 | $2,017 | $178,000 | $60,000 | $118,000 |
| 2014 | $1,519 | $135,000 | $30,000 | $105,000 |
Source: Public Records
Map
Nearby Homes
- 506 M St
- 1022 4th St
- 422 J St
- 631 I St
- 0 W Pacheco Blvd Unit 225148898
- 0 W Pacheco Blvd Unit MC25270249
- 1102 California Ave
- 820 J St
- 0 W I St Unit ML81999689
- 1144 G St
- 2114 Coulter Ln Unit 393P
- 1032 9th St
- 133 W I St
- 233 W I St
- 709 Madison Ave
- 20058 Cardoza Rd
- 1062 Madison Ave
- 226 7th St
- 1811 Mariposa Dr
- 146 Toscano Ct
Your Personal Tour Guide
Ask me questions while you tour the home.