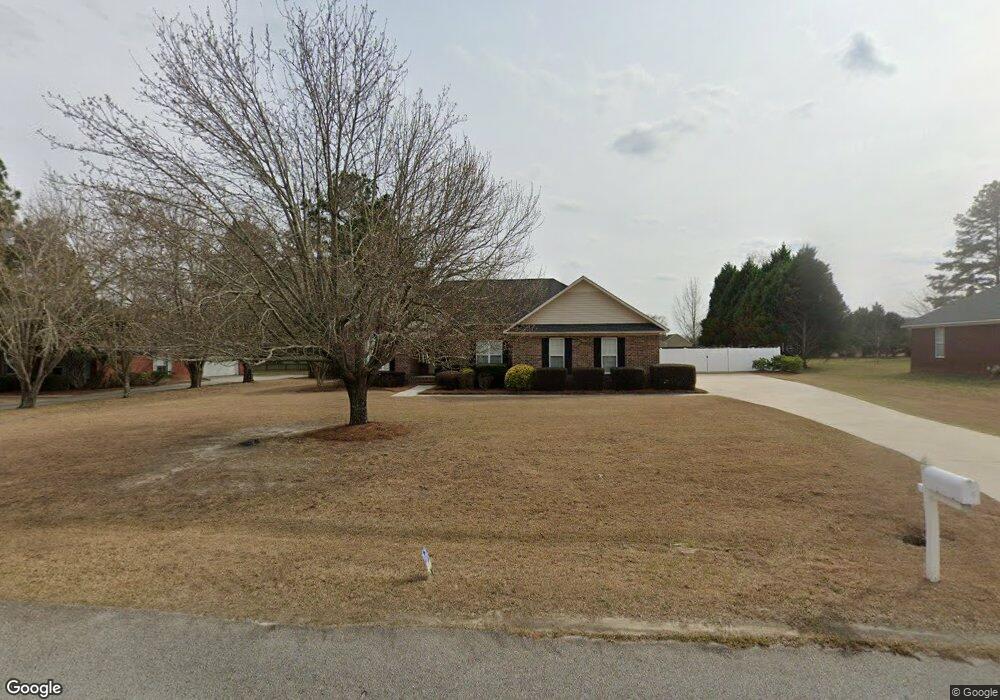
1130 Bartlett Dr Statesboro, GA 30461
Estimated Value: $310,165 - $330,000
3
Beds
2
Baths
1,893
Sq Ft
$169/Sq Ft
Est. Value
About This Home
This home is located at 1130 Bartlett Dr, Statesboro, GA 30461 and is currently estimated at $319,291, approximately $168 per square foot. 1130 Bartlett Dr is a home located in Bulloch County with nearby schools including Sallie Zetterower Elementary School, Statesboro High School, and Langston Chapel Middle School.
Ownership History
Date
Name
Owned For
Owner Type
Purchase Details
Closed on
Apr 19, 2011
Sold by
White Ross Mcgaugh
Bought by
Callahan James E
Current Estimated Value
Home Financials for this Owner
Home Financials are based on the most recent Mortgage that was taken out on this home.
Original Mortgage
$106,500
Outstanding Balance
$73,510
Interest Rate
4.81%
Mortgage Type
New Conventional
Estimated Equity
$245,781
Purchase Details
Closed on
Dec 12, 2005
Bought by
White Ross Mcgaugh and White Krystle Williams
Home Financials for this Owner
Home Financials are based on the most recent Mortgage that was taken out on this home.
Original Mortgage
$156,750
Interest Rate
6.29%
Mortgage Type
New Conventional
Purchase Details
Closed on
Dec 1, 2003
Bought by
Anderson Timothy J
Purchase Details
Closed on
Jul 1, 2000
Bought by
Cartwright Alwyn M
Purchase Details
Closed on
Jun 1, 2000
Bought by
Nesmith Construction Inc
Create a Home Valuation Report for This Property
The Home Valuation Report is an in-depth analysis detailing your home's value as well as a comparison with similar homes in the area
Home Values in the Area
Average Home Value in this Area
Purchase History
| Date | Buyer | Sale Price | Title Company |
|---|---|---|---|
| Callahan James E | $161,500 | -- | |
| White Ross Mcgaugh | -- | -- | |
| Anderson Timothy J | -- | -- | |
| Cartwright Alwyn M | -- | -- | |
| Nesmith Construction Inc | -- | -- |
Source: Public Records
Mortgage History
| Date | Status | Borrower | Loan Amount |
|---|---|---|---|
| Open | Callahan James E | $106,500 | |
| Previous Owner | White Ross Mcgaugh | $156,750 |
Source: Public Records
Tax History Compared to Growth
Tax History
| Year | Tax Paid | Tax Assessment Tax Assessment Total Assessment is a certain percentage of the fair market value that is determined by local assessors to be the total taxable value of land and additions on the property. | Land | Improvement |
|---|---|---|---|---|
| 2024 | $2,363 | $109,480 | $18,000 | $91,480 |
| 2023 | $2,235 | $95,000 | $12,000 | $83,000 |
| 2022 | $1,757 | $82,346 | $10,200 | $72,146 |
| 2021 | $1,555 | $71,380 | $10,200 | $61,180 |
| 2020 | $1,529 | $69,784 | $10,200 | $59,584 |
| 2019 | $1,519 | $69,006 | $9,280 | $59,726 |
| 2018 | $1,469 | $64,336 | $9,280 | $55,056 |
| 2017 | $1,449 | $62,824 | $9,280 | $53,544 |
| 2016 | $1,459 | $61,766 | $9,280 | $52,486 |
| 2015 | $1,480 | $62,414 | $9,280 | $53,134 |
| 2014 | $1,369 | $62,414 | $9,280 | $53,134 |
Source: Public Records
Map
Nearby Homes
- 1139 Bartlett Dr
- 1143 Bartlett Dr
- 1136 Bartlett Dr
- 1008 Cawana Rd
- 2.055 ACRES S and S Railroad Bed Rd
- 0 Cawana Rd Unit 10619496
- Cali Plan at Holly Oaks
- Kerry Plan at Holly Oaks
- Belhaven Plan at Holly Oaks
- Freeport Plan at Holly Oaks
- Manning Plan at Holly Oaks
- Robie Plan at Holly Oaks
- 314 Longwood Dr
- 115 Sandy Way
- 106 Lincoln St
- 522 Outpost Way
- 504 Outpost Way
- 520 Outpost Way
- 506 Outpost Way
- 9 Robin Hood Rd
- 1128 Bartlett Dr
- 1132 Bartlett Dr
- 1021 Bradford Way
- 1023 Bradford Way
- 1126 Bartlett Dr
- 1134 Bartlett Dr
- 1019 Bradford Way
- 1145 Bartlett Dr
- 1141 Bartlett Dr
- 1147 Bartlett Dr
- 1017 Bradford Way
- 1124 Bartlett Dr
- 1025 Bradford Way
- 1122 Bartlett Dr
- 1149 Bartlett Dr
- 1120 Bartlett Dr
- 1015 Bradford Way
- 1027 Bradford Way
- 1138 Bartlett Dr
- 1016 Bradford Way