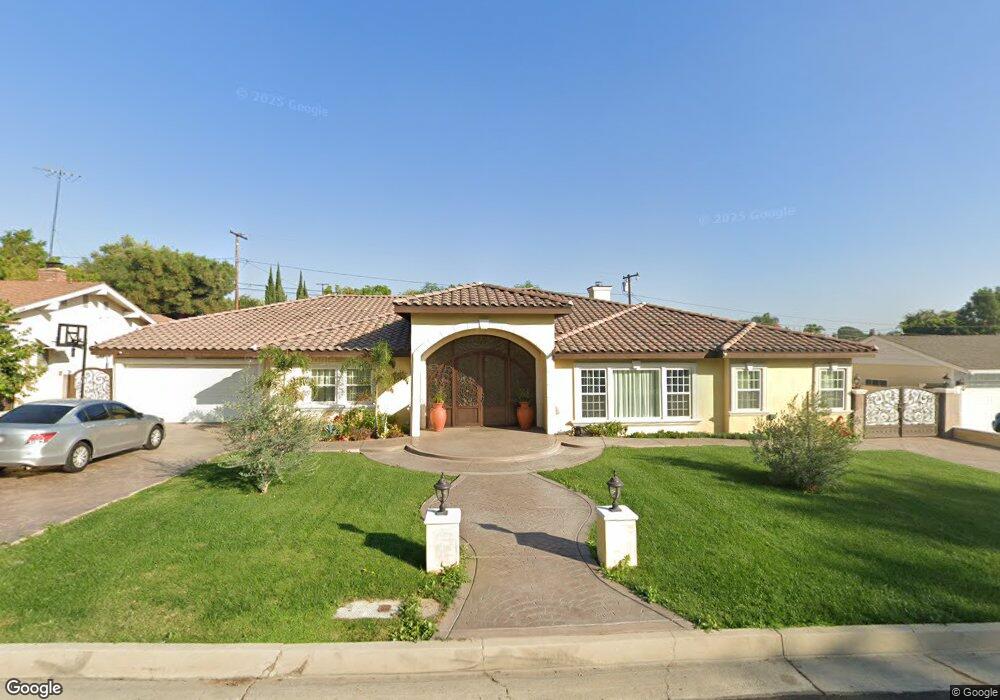
1130 Circle Dr La Habra, CA 90631
Estimated Value: $1,088,000 - $1,312,255
3
Beds
3
Baths
2,695
Sq Ft
$448/Sq Ft
Est. Value
About This Home
This home is located at 1130 Circle Dr, La Habra, CA 90631 and is currently estimated at $1,206,064, approximately $447 per square foot. 1130 Circle Dr is a home located in Orange County with nearby schools including El Cerrito Elementary School, Arbolita Elementary School, and Washington Middle School.
Ownership History
Date
Name
Owned For
Owner Type
Purchase Details
Closed on
Mar 20, 2007
Sold by
Christidis Theodore and Christidis Athena
Bought by
Campana Nelson Alfonso and Sanchez Maria Del Rosario
Current Estimated Value
Home Financials for this Owner
Home Financials are based on the most recent Mortgage that was taken out on this home.
Original Mortgage
$684,000
Interest Rate
8.75%
Mortgage Type
Purchase Money Mortgage
Purchase Details
Closed on
Dec 5, 2001
Sold by
Christidis Theodore and Christidis Athena
Bought by
Christidis Theodore and Christidis Athena
Purchase Details
Closed on
Apr 16, 1998
Sold by
Euphrat Elizabeth
Bought by
Christidis Theodore and Christidis Athena
Home Financials for this Owner
Home Financials are based on the most recent Mortgage that was taken out on this home.
Original Mortgage
$40,000
Interest Rate
7.06%
Create a Home Valuation Report for This Property
The Home Valuation Report is an in-depth analysis detailing your home's value as well as a comparison with similar homes in the area
Home Values in the Area
Average Home Value in this Area
Purchase History
| Date | Buyer | Sale Price | Title Company |
|---|---|---|---|
| Campana Nelson Alfonso | $720,000 | Chicago Title Co | |
| Christidis Theodore | -- | -- | |
| Christidis Theodore | -- | -- | |
| Christidis Theodore | $200,000 | First American Title Ins Co |
Source: Public Records
Mortgage History
| Date | Status | Borrower | Loan Amount |
|---|---|---|---|
| Previous Owner | Campana Nelson Alfonso | $684,000 | |
| Previous Owner | Christidis Theodore | $40,000 |
Source: Public Records
Tax History Compared to Growth
Tax History
| Year | Tax Paid | Tax Assessment Tax Assessment Total Assessment is a certain percentage of the fair market value that is determined by local assessors to be the total taxable value of land and additions on the property. | Land | Improvement |
|---|---|---|---|---|
| 2025 | $11,419 | $1,035,236 | $820,171 | $215,065 |
| 2024 | $11,419 | $1,014,938 | $804,089 | $210,849 |
| 2023 | $9,201 | $814,149 | $627,650 | $186,499 |
| 2022 | $9,113 | $798,186 | $615,343 | $182,843 |
| 2021 | $8,964 | $782,536 | $603,278 | $179,258 |
| 2020 | $8,968 | $782,536 | $603,278 | $179,258 |
| 2019 | $8,357 | $734,549 | $591,449 | $143,100 |
| 2018 | $7,876 | $689,000 | $579,852 | $109,148 |
| 2017 | $7,161 | $623,000 | $513,852 | $109,148 |
| 2016 | $6,615 | $576,326 | $467,178 | $109,148 |
| 2015 | $6,427 | $568,000 | $460,161 | $107,839 |
| 2014 | $5,750 | $511,000 | $403,161 | $107,839 |
Source: Public Records
Map
Nearby Homes
- 1020 La Serna Ave
- 1320 Marlei Rd
- 320 -330 Monte Vista
- 1421 Launer Dr
- 950 N Walnut St
- 581 W Greenwood Ave Unit 6
- 501 Willow St
- 1230 Sunbird Ave
- 421 N Marian St
- 161 W Hidden Ln
- 220 Olinda Ave
- 188 Madelena Dr
- 1100 N Euclid St
- 506 Dorothea Rd
- 401 Granada Dr
- 770 N Orange St
- 766 N Orange St
- 764 N Orange St
- 762 N Orange St
- 760 N Orange St
- 1120 Circle Dr
- 1140 Circle Dr
- 1101 Sierra Vista Dr
- 1121 Sierra Vista Dr
- 1061 Sierra Vista Dr
- 1141 Sierra Vista Dr
- 1131 Circle Dr
- 800 Circle Dr
- 1110 Circle Dr
- 1041 Sierra Vista Dr
- 1121 Circle Dr
- 810 Circle Dr
- 1161 Sierra Vista Dr
- 1111 Circle Dr
- 1021 Sierra Vista Dr
- 731 La Presa Dr
- 1100 Circle Dr
- 730 La Presa Dr
- 820 Circle Dr
- 730 El Camino Dr