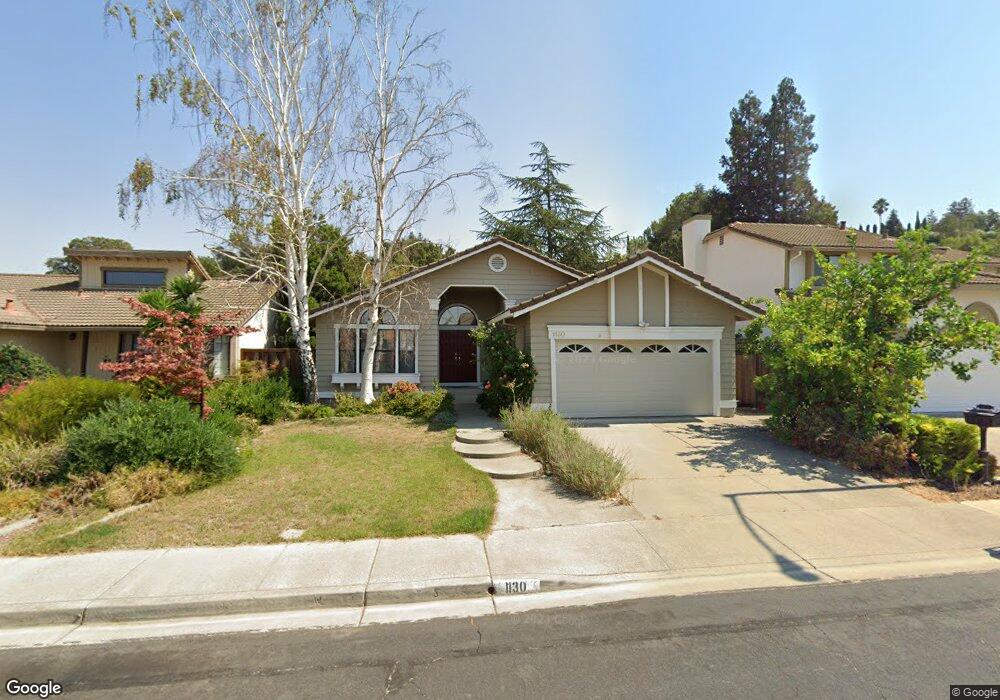
1130 Discovery Way Concord, CA 94521
The Highlands NeighborhoodEstimated Value: $914,022 - $973,000
3
Beds
2
Baths
1,633
Sq Ft
$572/Sq Ft
Est. Value
About This Home
This home is located at 1130 Discovery Way, Concord, CA 94521 and is currently estimated at $934,256, approximately $572 per square foot. 1130 Discovery Way is a home located in Contra Costa County with nearby schools including Highlands Elementary School, Mt. Diablo Elementary School, and Pine Hollow Middle School.
Ownership History
Date
Name
Owned For
Owner Type
Purchase Details
Closed on
May 20, 2020
Sold by
Sellberg Dina Marie B and Sellberg Jeffrey J
Bought by
Sellberg Jeffrey J
Current Estimated Value
Home Financials for this Owner
Home Financials are based on the most recent Mortgage that was taken out on this home.
Original Mortgage
$552,000
Outstanding Balance
$489,149
Interest Rate
3.3%
Mortgage Type
New Conventional
Estimated Equity
$445,107
Purchase Details
Closed on
Sep 19, 2017
Sold by
Westman Jeff L and Kaprielian Lena S
Bought by
Sellberg Jeffrey J and Sellberg Dina Marie B
Home Financials for this Owner
Home Financials are based on the most recent Mortgage that was taken out on this home.
Original Mortgage
$576,000
Interest Rate
3.9%
Mortgage Type
New Conventional
Purchase Details
Closed on
Oct 14, 2013
Sold by
Anwar Sayed and Anwar Moira F
Bought by
Westman Jeff L and Kaprielian Lena S
Home Financials for this Owner
Home Financials are based on the most recent Mortgage that was taken out on this home.
Original Mortgage
$417,000
Interest Rate
4.55%
Mortgage Type
New Conventional
Purchase Details
Closed on
Nov 17, 2009
Sold by
Sukkar Roger F and Sukkar Esperanza
Bought by
Anwar Sayed and Anwar Moira F
Purchase Details
Closed on
Oct 10, 2003
Sold by
Sukkar Roger and Sukkar Esperanza
Bought by
Sukkar Roger F and Sukkar Esperanza
Home Financials for this Owner
Home Financials are based on the most recent Mortgage that was taken out on this home.
Original Mortgage
$376,000
Interest Rate
5.98%
Mortgage Type
Purchase Money Mortgage
Purchase Details
Closed on
Apr 12, 2000
Sold by
Stiefvater Scott L and Stiefvater Chialo Y
Bought by
Stiefvater Scott I and Stiefvater Chialo Y
Purchase Details
Closed on
Mar 18, 1998
Sold by
Stiefvater Scott L and Stiefvater Chialo Y
Bought by
Stiefvater Scott L and Stiefvater Chialo Y
Home Financials for this Owner
Home Financials are based on the most recent Mortgage that was taken out on this home.
Original Mortgage
$177,500
Interest Rate
7.02%
Mortgage Type
Purchase Money Mortgage
Purchase Details
Closed on
May 21, 1996
Sold by
Costello Patricia A
Bought by
Stiefvater Scott L and Young Chialo
Home Financials for this Owner
Home Financials are based on the most recent Mortgage that was taken out on this home.
Original Mortgage
$169,600
Interest Rate
7.96%
Mortgage Type
Balloon
Create a Home Valuation Report for This Property
The Home Valuation Report is an in-depth analysis detailing your home's value as well as a comparison with similar homes in the area
Home Values in the Area
Average Home Value in this Area
Purchase History
| Date | Buyer | Sale Price | Title Company |
|---|---|---|---|
| Sellberg Jeffrey J | -- | Wfg National Title | |
| Sellberg Jeffrey J | $720,000 | Fidelity National Title Co | |
| Westman Jeff L | $530,000 | Fidelity National Title Comp | |
| Anwar Sayed | $445,000 | Placer Title Company | |
| Sukkar Roger F | -- | Old Republic Title | |
| Sukkar Roger | $470,000 | Old Republic Title | |
| Stiefvater Scott I | -- | -- | |
| Stiefvater Scott L | -- | Placer Title Company | |
| Stiefvater Scott L | $212,000 | Old Republic Title Company |
Source: Public Records
Mortgage History
| Date | Status | Borrower | Loan Amount |
|---|---|---|---|
| Open | Sellberg Jeffrey J | $552,000 | |
| Previous Owner | Sellberg Jeffrey J | $576,000 | |
| Previous Owner | Westman Jeff L | $417,000 | |
| Previous Owner | Sukkar Roger | $376,000 | |
| Previous Owner | Stiefvater Scott L | $177,500 | |
| Previous Owner | Stiefvater Scott L | $169,600 |
Source: Public Records
Tax History
| Year | Tax Paid | Tax Assessment Tax Assessment Total Assessment is a certain percentage of the fair market value that is determined by local assessors to be the total taxable value of land and additions on the property. | Land | Improvement |
|---|---|---|---|---|
| 2025 | $10,191 | $819,231 | $512,020 | $307,211 |
| 2024 | $9,766 | $803,169 | $501,981 | $301,188 |
| 2023 | $9,766 | $787,422 | $492,139 | $295,283 |
| 2022 | $9,647 | $771,984 | $482,490 | $289,494 |
| 2021 | $9,422 | $756,848 | $473,030 | $283,818 |
| 2019 | $9,252 | $734,400 | $459,000 | $275,400 |
| 2018 | $8,912 | $720,000 | $450,000 | $270,000 |
| 2017 | $6,942 | $559,807 | $400,105 | $159,702 |
| 2016 | $6,758 | $548,831 | $392,260 | $156,571 |
| 2015 | $6,702 | $540,588 | $386,368 | $154,220 |
| 2014 | $6,656 | $530,000 | $378,800 | $151,200 |
Source: Public Records
Map
Nearby Homes
- 1109 Vista Point Ln
- 1271 Kentucky Dr
- 1297 Kansas Cir
- 5350 Fernbank Dr Unit 1
- 5391 Fernbank Dr
- 5434 Roundtree Ct Unit A
- 1120 Kenwal Rd Unit C
- 1195 Kenwal Rd Unit B
- 5092 Black Oak Rd
- 5468 Roundtree Dr Unit C
- 995 Rosehedge Ct
- 5451 Roundtree Place
- 5492 Roundtree Dr Unit A
- 1002 Pinehurst Ct
- 5506 Nebraska Dr
- 868 Deer Spring Cir
- 1025 Pinehurst Ct
- 5500 Lewis Way
- 1395 Kenwal Rd Unit A
- 5408 Oakstone Ct
- 1132 Discovery Way
- 1128 Discovery Way
- 1126 Discovery Way
- 1127 Discovery Way
- 1125 Discovery Way
- 1136 Discovery Way
- 1129 Discovery Way
- 1124 Discovery Way
- 1131 Discovery Way
- 1123 Discovery Way
- 1133 Discovery Way
- 1122 Discovery Way
- 1138 Discovery Way
- 1121 Discovery Way
- 1135 Discovery Way
- 1140 Discovery Way
- 1120 Discovery Way
- 1119 Discovery Way
- 1137 Discovery Way
- 1142 Discovery Way
Your Personal Tour Guide
Ask me questions while you tour the home.