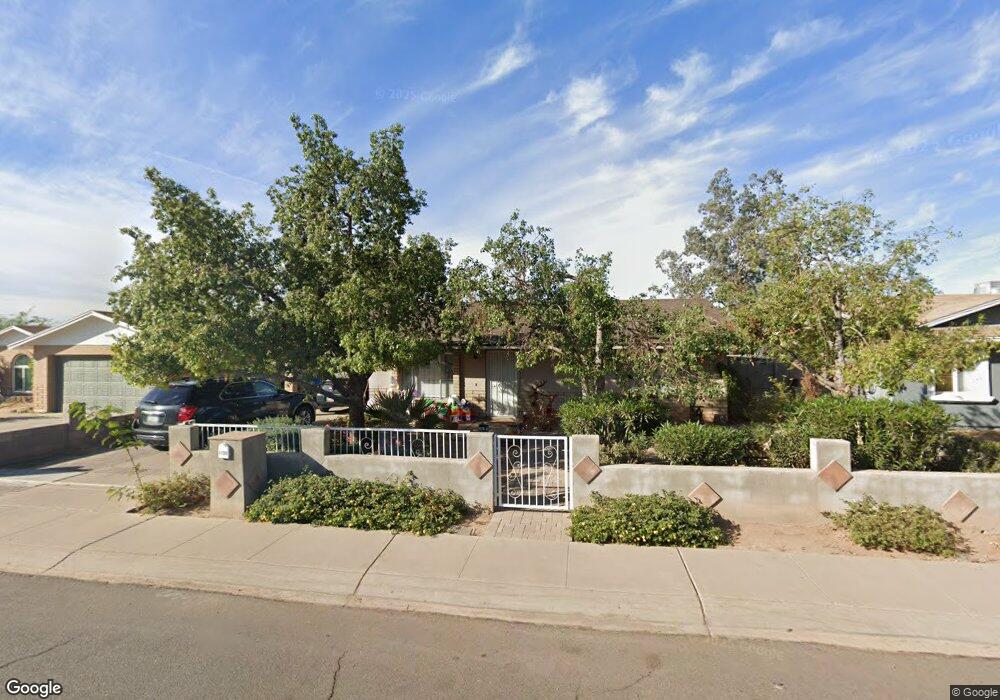
1130 N 59th Dr Phoenix, AZ 85043
Estrella Village NeighborhoodEstimated Value: $241,000 - $340,000
3
Beds
2
Baths
1,310
Sq Ft
$214/Sq Ft
Est. Value
About This Home
This home is located at 1130 N 59th Dr, Phoenix, AZ 85043 and is currently estimated at $279,998, approximately $213 per square foot. 1130 N 59th Dr is a home located in Maricopa County with nearby schools including Sunridge Elementary School, Santa Maria Middle School, and Sierra Linda High School.
Ownership History
Date
Name
Owned For
Owner Type
Purchase Details
Closed on
Jan 8, 2010
Sold by
Donovan Shaun
Bought by
Alvarez Miguel
Current Estimated Value
Purchase Details
Closed on
Jul 24, 2009
Sold by
Wells Fargo Bank Na
Bought by
Secretary Of Housing & Urban Development
Purchase Details
Closed on
Jun 29, 2009
Sold by
Emery Dawn
Bought by
Wells Fargo Bank Na
Purchase Details
Closed on
Dec 24, 2003
Sold by
Ojeda George D
Bought by
Emery Dawn
Home Financials for this Owner
Home Financials are based on the most recent Mortgage that was taken out on this home.
Original Mortgage
$86,937
Interest Rate
5.79%
Mortgage Type
FHA
Purchase Details
Closed on
Apr 1, 1999
Sold by
Billington Kenneth R and Hagan Sandra L
Bought by
Ojeda George D
Home Financials for this Owner
Home Financials are based on the most recent Mortgage that was taken out on this home.
Original Mortgage
$63,121
Interest Rate
6.79%
Mortgage Type
FHA
Create a Home Valuation Report for This Property
The Home Valuation Report is an in-depth analysis detailing your home's value as well as a comparison with similar homes in the area
Home Values in the Area
Average Home Value in this Area
Purchase History
| Date | Buyer | Sale Price | Title Company |
|---|---|---|---|
| Alvarez Miguel | -- | Grand Canyon Title Agency | |
| Secretary Of Housing & Urban Development | -- | First American Title Ins Co | |
| Wells Fargo Bank Na | $94,178 | First American Title Ins Co | |
| Emery Dawn | $88,230 | Lawyers Title Ins Corp | |
| Ojeda George D | $63,900 | Fidelity Title |
Source: Public Records
Mortgage History
| Date | Status | Borrower | Loan Amount |
|---|---|---|---|
| Previous Owner | Emery Dawn | $86,937 | |
| Previous Owner | Ojeda George D | $63,121 |
Source: Public Records
Tax History
| Year | Tax Paid | Tax Assessment Tax Assessment Total Assessment is a certain percentage of the fair market value that is determined by local assessors to be the total taxable value of land and additions on the property. | Land | Improvement |
|---|---|---|---|---|
| 2025 | $689 | $4,929 | -- | -- |
| 2024 | $617 | $4,695 | -- | -- |
| 2023 | $617 | $20,130 | $4,020 | $16,110 |
| 2022 | $601 | $14,210 | $2,840 | $11,370 |
| 2021 | $568 | $14,070 | $2,810 | $11,260 |
| 2020 | $549 | $12,050 | $2,410 | $9,640 |
| 2019 | $543 | $9,630 | $1,920 | $7,710 |
| 2018 | $507 | $9,650 | $1,930 | $7,720 |
| 2017 | $479 | $7,350 | $1,470 | $5,880 |
| 2016 | $472 | $5,900 | $1,180 | $4,720 |
| 2015 | $367 | $5,570 | $1,110 | $4,460 |
Source: Public Records
Map
Nearby Homes
- 6320 W Mckinley St
- 1616 N 63rd Ave Unit 30
- 1616 N 63rd Ave Unit 48
- 6224 W Berkeley Rd
- 6213 W Palm Ln
- 5940 W Palm Ln
- 5921 W Hubbell St
- 6420 W Van Buren St Unit B4
- 6423 W Almeria Rd
- 1420 N 54th Ave
- 6430 W Van Buren St Unit 10
- 1447 N 53rd Dr Unit 902
- 1463 N 53rd Dr Unit 895
- 6610 W Mckinley St
- 2223 N 62nd Ln
- 5228 W Brill St
- 5220 W Lynwood St Unit 843
- 6609 W Johnson St
- 2042 N 64th Dr
- 6606 W Polk St
- 1134 N 59th Dr
- 1129 N 60th Ave
- 1120 N 59th Dr
- 1123 N 60th Ave
- 1133 N 60th Ave
- 1129 N 59th Dr
- 1123 N 59th Dr
- 1137 N 60th Ave
- 1119 N 60th Ave
- 1112 N 59th Dr
- 1144 N 59th Dr
- 1137 N 59th Dr
- 1119 N 59th Dr
- 1111 N 60th Ave
- 1143 N 60th Ave
- 1143 N 59th Dr
- 1111 N 59th Dr
- 1130 N 60th Ave
- 1130 N 59th Ave
- 1124 N 60th Ave
Your Personal Tour Guide
Ask me questions while you tour the home.