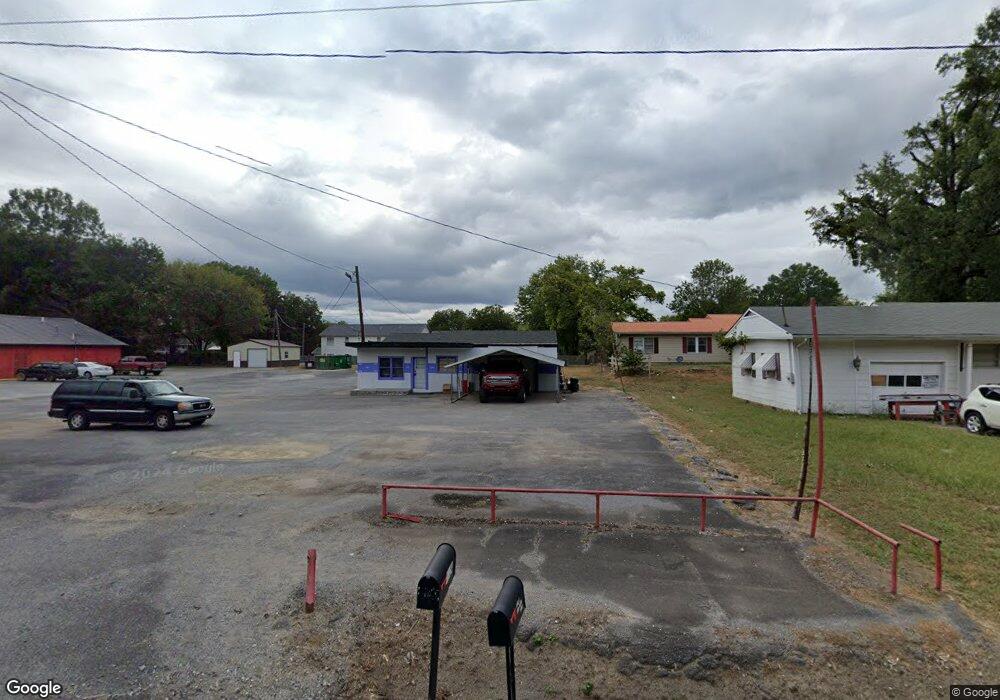
1130 N Wall St Calhoun, GA 30701
Estimated Value: $90,000 - $174,000
2
Beds
1
Bath
988
Sq Ft
$125/Sq Ft
Est. Value
About This Home
This home is located at 1130 N Wall St, Calhoun, GA 30701 and is currently estimated at $123,887, approximately $125 per square foot. 1130 N Wall St is a home located in Gordon County with nearby schools including Red Bud Elementary School, Red Bud Middle School, and Sonoraville High School.
Ownership History
Date
Name
Owned For
Owner Type
Purchase Details
Closed on
May 30, 2014
Sold by
Hensley Arthur L
Bought by
Hensley Timothy David
Current Estimated Value
Purchase Details
Closed on
Nov 14, 1996
Bought by
Hensley Jessie
Create a Home Valuation Report for This Property
The Home Valuation Report is an in-depth analysis detailing your home's value as well as a comparison with similar homes in the area
Home Values in the Area
Average Home Value in this Area
Purchase History
| Date | Buyer | Sale Price | Title Company |
|---|---|---|---|
| Hensley Timothy David | -- | -- | |
| Hensley Arthur L | -- | -- | |
| Hensley Jessie | $32,000 | -- |
Source: Public Records
Tax History Compared to Growth
Tax History
| Year | Tax Paid | Tax Assessment Tax Assessment Total Assessment is a certain percentage of the fair market value that is determined by local assessors to be the total taxable value of land and additions on the property. | Land | Improvement |
|---|---|---|---|---|
| 2024 | $604 | $25,760 | $2,520 | $23,240 |
| 2023 | $566 | $24,280 | $2,520 | $21,760 |
| 2022 | $567 | $23,000 | $2,520 | $20,480 |
| 2021 | $471 | $18,800 | $2,520 | $16,280 |
| 2020 | $489 | $19,080 | $2,520 | $16,560 |
| 2019 | $492 | $19,080 | $2,520 | $16,560 |
| 2018 | $459 | $17,920 | $2,520 | $15,400 |
| 2017 | $443 | $16,960 | $2,520 | $14,440 |
| 2016 | $444 | $16,960 | $2,520 | $14,440 |
| 2015 | $433 | $16,440 | $2,520 | $13,920 |
| 2014 | $463 | $15,905 | $2,520 | $13,385 |
Source: Public Records
Map
Nearby Homes
- 1215 U S 41
- 145 Green Row
- 106 Windmill Ct
- 104 Windmill Ct
- 111 Nike Dr
- 367 Mount Vernon Dr
- 00 Mauldin Rd NW
- 000 Mauldin Rd
- 118 Old Mill Dr
- 115 Old Mill Dr
- 122 Millers Ln
- 137 Millers Ln
- 135 Millers Ln
- 154 Millers Ln
- 106 Millers Ln
- 113 Mill Pond Ln
- 108 Mill Stone Dr
- 125 Mill Pond Ln
- 106 Mount Vernon Dr
- 98 Echota 5th St
- 1130 N Wall St
- 202 Harrison Dr
- 200 Harrison Dr
- 201 Harrison Dr
- 201 Harrison Dr
- 204 Harrison Dr
- 215 Harrison Dr
- 207 Harrison Dr
- 209 Harrison Dr
- 215 Harrison Dr
- 217 Harrison Dr
- 209 Harrison Dr
- 207 Harrison Dr
- 220 Harrison Dr
- 218 Harrison Dr
- 221 Harrison Dr
- 219 Harrison Dr
- 221 Harrison Dr
- 214 Harrison Dr
- 1149 N Wall St