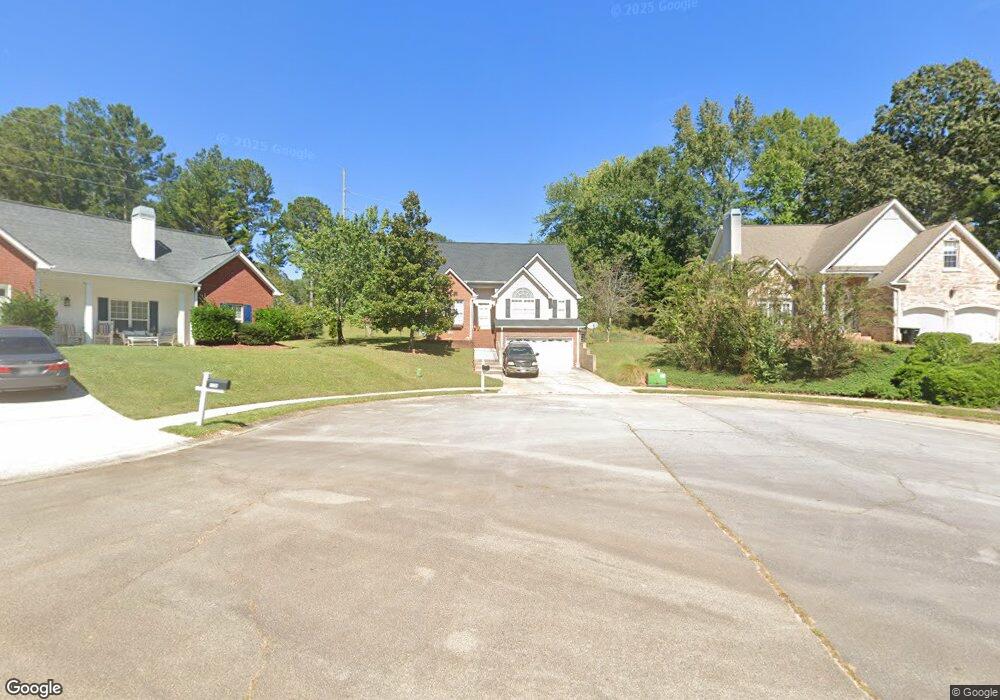
1130 Stone Brook Ln Bremen, GA 30110
Estimated Value: $271,000 - $352,000
3
Beds
3
Baths
1,938
Sq Ft
$155/Sq Ft
Est. Value
About This Home
This home is located at 1130 Stone Brook Ln, Bremen, GA 30110 and is currently estimated at $299,529, approximately $154 per square foot. 1130 Stone Brook Ln is a home located in Haralson County with nearby schools including Jones Elementary School, Bremen 4th & 5th Grade Academy, and Bremen Middle School.
Ownership History
Date
Name
Owned For
Owner Type
Purchase Details
Closed on
Feb 19, 2016
Sold by
Citimortgage Inc
Bought by
Certus Llc
Current Estimated Value
Purchase Details
Closed on
Oct 6, 2015
Sold by
Swanson Nathan
Bought by
Citimortgage Inc
Purchase Details
Closed on
Sep 7, 2005
Sold by
Prudential Relocation Inc
Bought by
Swanson Nathan
Home Financials for this Owner
Home Financials are based on the most recent Mortgage that was taken out on this home.
Original Mortgage
$148,650
Interest Rate
5.86%
Mortgage Type
FHA
Purchase Details
Closed on
Apr 17, 2005
Sold by
Privette Pamela S
Bought by
Prudential Relocation Inc
Purchase Details
Closed on
Mar 30, 2001
Sold by
A J Muse Construction
Bought by
Privette Pamela S and Mcnelis Patrick
Purchase Details
Closed on
Nov 9, 2000
Sold by
M & R Properties Inc
Bought by
A J Muse Construction
Purchase Details
Closed on
Jan 26, 1998
Sold by
M & R Properties Inc
Bought by
M & R Properties Inc
Create a Home Valuation Report for This Property
The Home Valuation Report is an in-depth analysis detailing your home's value as well as a comparison with similar homes in the area
Home Values in the Area
Average Home Value in this Area
Purchase History
| Date | Buyer | Sale Price | Title Company |
|---|---|---|---|
| Certus Llc | $115,300 | -- | |
| Citimortgage Inc | -- | -- | |
| Swanson Nathan | $152,500 | -- | |
| Prudential Relocation Inc | -- | -- | |
| Privette Pamela S | $134,500 | -- | |
| A J Muse Construction | $22,000 | -- | |
| M & R Properties Inc | -- | -- |
Source: Public Records
Mortgage History
| Date | Status | Borrower | Loan Amount |
|---|---|---|---|
| Previous Owner | Swanson Nathan | $148,650 |
Source: Public Records
Tax History Compared to Growth
Tax History
| Year | Tax Paid | Tax Assessment Tax Assessment Total Assessment is a certain percentage of the fair market value that is determined by local assessors to be the total taxable value of land and additions on the property. | Land | Improvement |
|---|---|---|---|---|
| 2024 | $2,918 | $103,890 | $7,200 | $96,690 |
| 2023 | $3,376 | $112,291 | $7,200 | $105,091 |
| 2022 | $856 | $88,817 | $7,200 | $81,617 |
| 2021 | $855 | $84,640 | $7,200 | $77,440 |
| 2020 | $816 | $80,404 | $7,200 | $73,204 |
| 2019 | $623 | $59,317 | $7,200 | $52,117 |
| 2018 | $631 | $59,317 | $7,200 | $52,117 |
| 2017 | $546 | $62,424 | $7,200 | $55,224 |
| 2016 | $683 | $54,952 | $7,200 | $47,752 |
| 2015 | $633 | $50,776 | $7,200 | $43,576 |
| 2014 | $692 | $51,839 | $7,200 | $44,639 |
Source: Public Records
Map
Nearby Homes
- 626 Georgia Ave S
- 937 Daylilly Hill
- The Rose Plan at Creekside at Magnolia
- The Hudson Plan at Creekside at Magnolia
- 601 Hydrangea Ln
- 812 Brown Thrasher Way
- 504 Silver Leaf Pkwy
- 805 Brown Thrasher Way
- 805 Laurel St
- 853 Brown Thrasher Way
- 0 Valley Run Unit 10575700
- 0 Valley Run Unit 24315047
- 503 Mystic Ave
- 208 Georgia Ave S
- 124 Greystone Dr
- 909 Laurel St
- 110 Florida Ave
- 201 Georgia Ave S
- 1130 Stone Brook Ln Unit 6
- 1132 Stone Brook Ln
- 1128 Stone Brook Ln
- 707 Georgia Ave S
- 707 Georgia Ave S Unit 30
- 1134 Stone Brook Ln
- 1126 Stone Brook Ln
- 640 Cantrell Dr
- 1136 Stone Brook Ln
- 708 Georgia Ave S
- 1127 Stone Brook Ln
- 1129 Stone Brook Ln
- 1125 Stone Brook Ln
- 1124 Stone Brook Ln
- 1131 Stone Brook Ln
- 703 Georgia Ave S
- 1138 Stone Brook Ln
- 638 Cantrell Dr
- 1123 Stone Brook Ln
- 1122 Stone Brook Ln