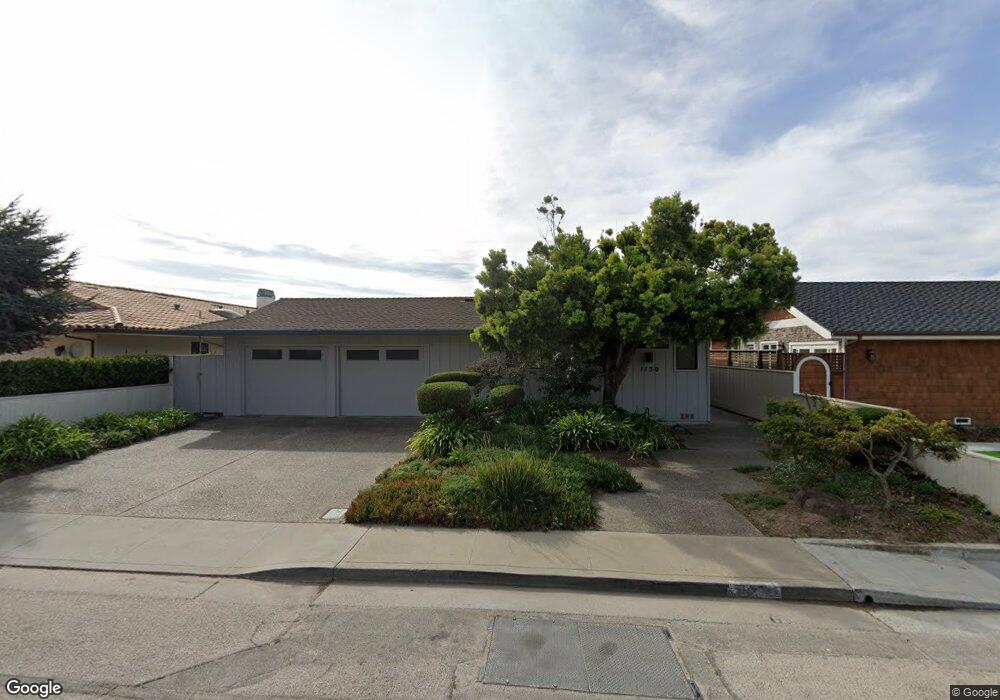
1130 Via Palo Alto Aptos, CA 95003
Rio del Mar NeighborhoodEstimated Value: $1,859,000 - $3,109,000
2
Beds
2
Baths
2,245
Sq Ft
$1,044/Sq Ft
Est. Value
About This Home
This home is located at 1130 Via Palo Alto, Aptos, CA 95003 and is currently estimated at $2,344,256, approximately $1,044 per square foot. 1130 Via Palo Alto is a home located in Santa Cruz County with nearby schools including Rio Del Mar Elementary School, Aptos Junior High School, and Aptos High School.
Ownership History
Date
Name
Owned For
Owner Type
Purchase Details
Closed on
Feb 9, 2021
Sold by
Swank Gerald E and Swank Janice F
Bought by
Mohney Janna Elizabeth and Swank Jack Jerald
Current Estimated Value
Purchase Details
Closed on
Jun 22, 2004
Sold by
Mcguire Paul C and Mcguire Deborah
Bought by
Mcguire Paul C and Mcguire Deborah D
Purchase Details
Closed on
Jun 2, 2003
Sold by
Swank Gerald E and Swank Janice F R
Bought by
Swank Gerald E and Swank Janice F R
Purchase Details
Closed on
Mar 3, 2003
Sold by
Mcguire Paul C and Mcguire Deborah
Bought by
Mcguire Paul C and Mcguire Deborah D
Purchase Details
Closed on
Jan 25, 2000
Sold by
Mcguire Paul C and Mcguire Deborah Hw
Bought by
Mcguire Paul C and Mcguire Deborah D
Create a Home Valuation Report for This Property
The Home Valuation Report is an in-depth analysis detailing your home's value as well as a comparison with similar homes in the area
Home Values in the Area
Average Home Value in this Area
Purchase History
| Date | Buyer | Sale Price | Title Company |
|---|---|---|---|
| Mohney Janna Elizabeth | -- | None Available | |
| Swank Gerald E | -- | None Available | |
| Swank Family Properties Lp | -- | None Available | |
| Swank Gerald E | -- | None Available | |
| Swank Gerald E | -- | None Available | |
| Mcguire Paul C | -- | -- | |
| Swank Gerald E | -- | First American Title Guarant | |
| Mcguire Paul C | -- | First American Title Guarant | |
| Mcguire Paul C | -- | First American Title Guarant |
Source: Public Records
Tax History Compared to Growth
Tax History
| Year | Tax Paid | Tax Assessment Tax Assessment Total Assessment is a certain percentage of the fair market value that is determined by local assessors to be the total taxable value of land and additions on the property. | Land | Improvement |
|---|---|---|---|---|
| 2025 | $13,589 | $1,845,515 | $1,421,170 | $424,345 |
| 2023 | $13,324 | $1,102,764 | $776,018 | $326,746 |
| 2022 | $13,048 | $1,081,142 | $760,802 | $320,340 |
| 2021 | $12,696 | $1,059,942 | $745,884 | $314,058 |
| 2020 | $12,489 | $1,049,074 | $738,236 | $310,838 |
| 2019 | $12,269 | $1,028,504 | $723,760 | $304,744 |
| 2018 | $11,944 | $1,008,338 | $709,570 | $298,768 |
| 2017 | $11,840 | $988,566 | $695,656 | $292,910 |
| 2016 | $11,543 | $969,182 | $682,016 | $287,166 |
| 2015 | $11,454 | $954,624 | $671,772 | $282,852 |
| 2014 | $11,193 | $935,924 | $658,612 | $277,312 |
Source: Public Records
Map
Nearby Homes
- 1103 Via Tornasol
- 22 Seascape Resort Dr
- 29 Seascape Resort Dr
- 60 Seascape Resort Dr
- 1325 Dolphin Dr
- 175 Tamarack Dr
- 302 Seascape Resort Dr
- 121 Greenbrier Dr
- 315 Seascape Resort Dr
- 312 Seascape Resort Dr
- 117 Seascape Resort Dr
- 221 Seascape Resort Dr
- 664 Bayview Dr
- 123 Seascape Resort Dr Unit 123
- 1540 Seascape Blvd Unit 2
- 452 Seascape Resort Dr
- 1514 Dolphin Dr
- 630 Baltusrol Dr
- 643 Beach Dr
- 230 Thunderbird Dr
- 1118 Via Palo Alto
- 1142 Via Palo Alto
- 1106 Via Palo Alto
- 1148 Via Palo Alto
- 1094 Via Palo Alto
- 1100 Via Malibu
- 1080 Via Malibu
- 1104 Via Malibu
- 1102 Via Malibu
- 1106 Via Malibu
- 1058 Via Malibu
- 1074 Via Palo Alto
- 1108 Via Malibu
- 1046 Via Malibu
- 1034 Via Malibu
- 1062 Via Palo Alto
- 1110 Via Malibu
- 1101 Via Malibu
- 1103 Via Malibu
- 1105 Via Malibu