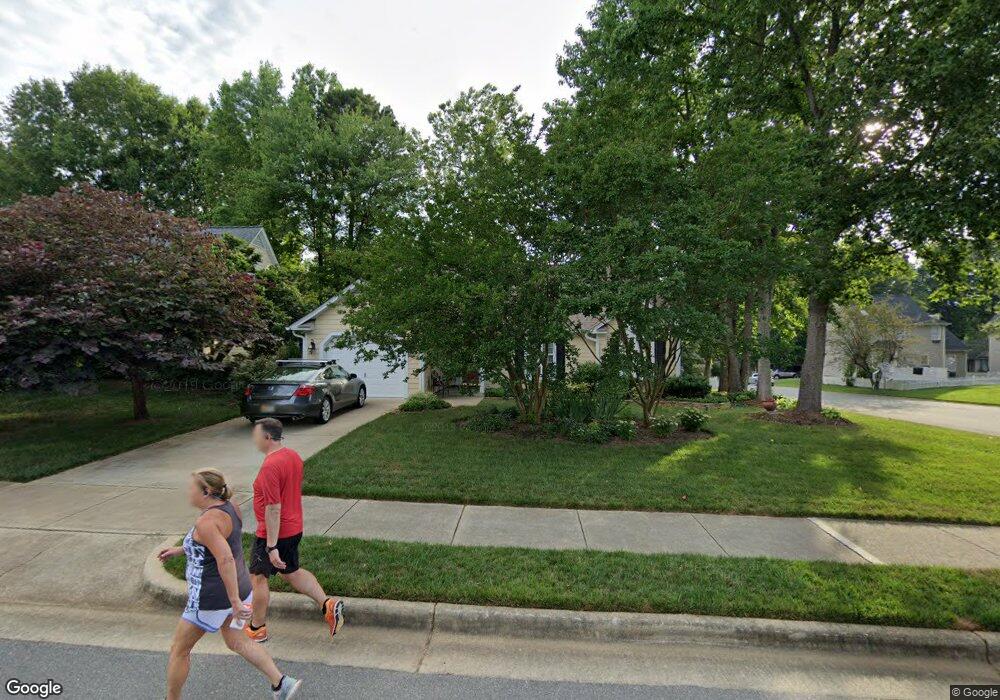
11300 N Radner Way Raleigh, NC 27613
Umstead NeighborhoodEstimated Value: $419,000 - $459,000
3
Beds
2
Baths
1,410
Sq Ft
$307/Sq Ft
Est. Value
About This Home
This home is located at 11300 N Radner Way, Raleigh, NC 27613 and is currently estimated at $433,333, approximately $307 per square foot. 11300 N Radner Way is a home located in Wake County with nearby schools including Sycamore Creek Elementary School, Pine Hollow Middle School, and Leesville Road High School.
Ownership History
Date
Name
Owned For
Owner Type
Purchase Details
Closed on
Nov 27, 2007
Sold by
Pittman Darin and Pittman Melissa
Bought by
Mcpeak Polly A
Current Estimated Value
Home Financials for this Owner
Home Financials are based on the most recent Mortgage that was taken out on this home.
Original Mortgage
$141,000
Interest Rate
6.32%
Mortgage Type
Purchase Money Mortgage
Purchase Details
Closed on
Apr 30, 2002
Sold by
Oneto Augusto L and Oneto Elisa C
Bought by
Pittman Darin and Pittman Melissa
Home Financials for this Owner
Home Financials are based on the most recent Mortgage that was taken out on this home.
Original Mortgage
$147,950
Interest Rate
7.07%
Purchase Details
Closed on
Feb 26, 1999
Sold by
Khuu Phong
Bought by
Oneto Augusto Luis and Oneto Elisa C
Create a Home Valuation Report for This Property
The Home Valuation Report is an in-depth analysis detailing your home's value as well as a comparison with similar homes in the area
Home Values in the Area
Average Home Value in this Area
Purchase History
| Date | Buyer | Sale Price | Title Company |
|---|---|---|---|
| Mcpeak Polly A | $188,000 | None Available | |
| Pittman Darin | $148,000 | -- | |
| Oneto Augusto Luis | $134,000 | -- |
Source: Public Records
Mortgage History
| Date | Status | Borrower | Loan Amount |
|---|---|---|---|
| Previous Owner | Mcpeak Polly A | $141,000 | |
| Previous Owner | Mcpeak Polly A | $47,000 | |
| Previous Owner | Pittman Darin | $147,950 |
Source: Public Records
Tax History Compared to Growth
Tax History
| Year | Tax Paid | Tax Assessment Tax Assessment Total Assessment is a certain percentage of the fair market value that is determined by local assessors to be the total taxable value of land and additions on the property. | Land | Improvement |
|---|---|---|---|---|
| 2025 | $3,440 | $392,176 | $150,000 | $242,176 |
| 2024 | $3,426 | $392,176 | $150,000 | $242,176 |
| 2023 | $2,923 | $266,362 | $74,000 | $192,362 |
| 2022 | $2,717 | $266,362 | $74,000 | $192,362 |
| 2021 | $2,612 | $266,362 | $74,000 | $192,362 |
| 2020 | $2,564 | $266,362 | $74,000 | $192,362 |
| 2019 | $2,490 | $213,119 | $74,000 | $139,119 |
| 2018 | $2,349 | $213,119 | $74,000 | $139,119 |
| 2017 | $2,237 | $213,119 | $74,000 | $139,119 |
| 2016 | $2,191 | $213,119 | $74,000 | $139,119 |
| 2015 | $2,108 | $201,667 | $64,000 | $137,667 |
| 2014 | -- | $201,667 | $64,000 | $137,667 |
Source: Public Records
Map
Nearby Homes
- 12200 Inglehurst Dr
- 12316 Inglehurst Dr
- 5700 Earlham Ct
- 5404 Staysail Ct
- 11113 N Radner Way
- 12316 Amoretto Way
- 5316 Easthorpe Dr
- 5216 Sutter Way
- 5501 Stewartby Dr
- 5000 Morning Edge Dr
- 11017 Peacock Moss St
- 1204 Meadow Moss Ct
- 5024 Dawn Piper Dr
- 5008 Dawn Piper Dr
- 5233 Fairmead Cir
- 5308 Roan Mountain Place
- 12018 Mcbride Dr
- 5519 Spindlewood Ct
- 9808 Goodrum Ct
- 11209 Sedgefield Dr
- 11304 N Radner Way
- 12216 Inglehurst Dr
- 12212 Inglehurst Dr
- 11308 N Radner Way
- 12208 Inglehurst Dr
- 12300 Inglehurst Dr
- 11301 N Radner Way
- 11305 N Radner Way
- 11233 N Radner Way
- 11224 N Radner Way
- 11309 N Radner Way
- 11312 N Radner Way
- 12204 Inglehurst Dr
- 12304 Inglehurst Dr
- 11229 N Radner Way
- 5401 Fairbridge Rd
- 11313 N Radner Way
- 12209 Inglehurst Dr
- 12325 Harcourt Dr
- 12401 Harcourt Dr