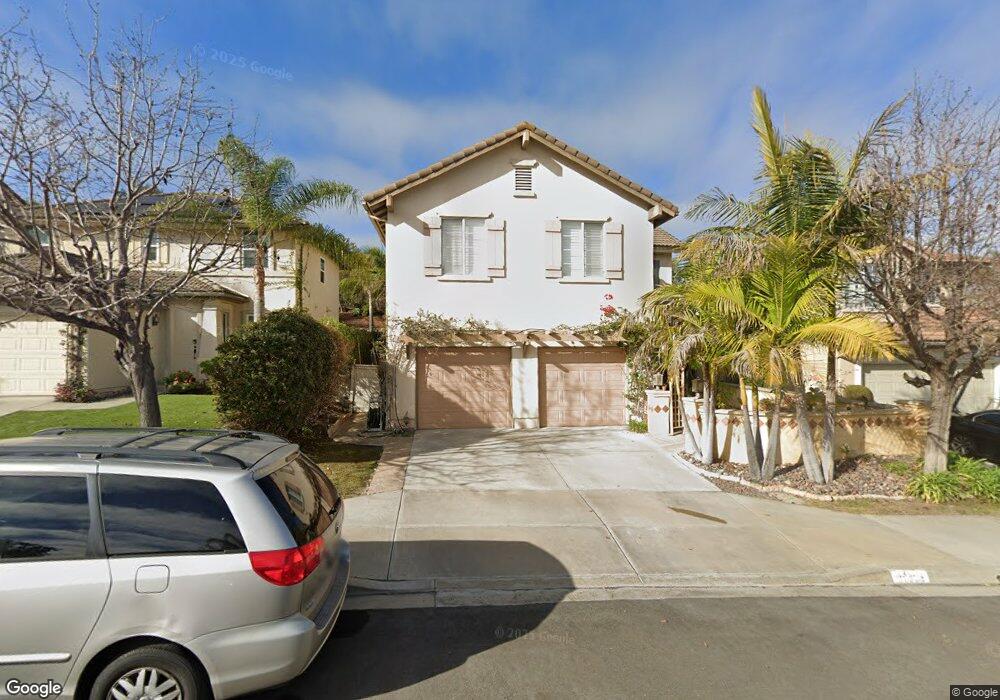
11302 Pepperview Terrace San Diego, CA 92131
Miramar Ranch North NeighborhoodEstimated Value: $1,610,000 - $1,959,000
4
Beds
3
Baths
2,554
Sq Ft
$681/Sq Ft
Est. Value
About This Home
This home is located at 11302 Pepperview Terrace, San Diego, CA 92131 and is currently estimated at $1,738,946, approximately $680 per square foot. 11302 Pepperview Terrace is a home located in San Diego County with nearby schools including Scripps Elementary School, Thurgood Marshall Middle School, and Scripps Ranch High School.
Ownership History
Date
Name
Owned For
Owner Type
Purchase Details
Closed on
Jul 8, 2019
Sold by
Nguyen Tan D and Nguyen Camqui
Bought by
Nguyen Tan D and Nguyen Camqui
Current Estimated Value
Purchase Details
Closed on
Feb 2, 2001
Sold by
Day Thomas W and Day Doris S
Bought by
Nguyen Tan D and Nguyen Camqui
Home Financials for this Owner
Home Financials are based on the most recent Mortgage that was taken out on this home.
Original Mortgage
$275,000
Outstanding Balance
$99,334
Interest Rate
7.08%
Estimated Equity
$1,639,612
Purchase Details
Closed on
Oct 8, 1999
Sold by
Skolnick Steven
Bought by
Skolnick Steven
Purchase Details
Closed on
Jul 2, 1999
Sold by
Brookfield Sundance Inc
Bought by
Day Thomas W and Day Doris S
Home Financials for this Owner
Home Financials are based on the most recent Mortgage that was taken out on this home.
Original Mortgage
$240,000
Interest Rate
7.77%
Create a Home Valuation Report for This Property
The Home Valuation Report is an in-depth analysis detailing your home's value as well as a comparison with similar homes in the area
Home Values in the Area
Average Home Value in this Area
Purchase History
| Date | Buyer | Sale Price | Title Company |
|---|---|---|---|
| Nguyen Tan D | -- | None Available | |
| Nguyen Tan D | $428,000 | Chicago Title Co | |
| Skolnick Steven | -- | First American Title Ins Co | |
| Day Thomas W | $322,000 | First American Title |
Source: Public Records
Mortgage History
| Date | Status | Borrower | Loan Amount |
|---|---|---|---|
| Open | Nguyen Tan D | $275,000 | |
| Previous Owner | Day Thomas W | $240,000 | |
| Closed | Day Thomas W | $15,001 | |
| Closed | Nguyen Tan D | $100,000 |
Source: Public Records
Tax History Compared to Growth
Tax History
| Year | Tax Paid | Tax Assessment Tax Assessment Total Assessment is a certain percentage of the fair market value that is determined by local assessors to be the total taxable value of land and additions on the property. | Land | Improvement |
|---|---|---|---|---|
| 2025 | $8,344 | $665,403 | $180,360 | $485,043 |
| 2024 | $8,344 | $652,357 | $176,824 | $475,533 |
| 2023 | $8,148 | $639,566 | $173,357 | $466,209 |
| 2022 | $7,867 | $627,026 | $169,958 | $457,068 |
| 2021 | $7,799 | $614,732 | $166,626 | $448,106 |
| 2020 | $7,708 | $608,430 | $164,918 | $443,512 |
| 2019 | $7,904 | $596,501 | $161,685 | $434,816 |
| 2018 | $8,187 | $584,806 | $158,515 | $426,291 |
| 2017 | $8,036 | $573,340 | $155,407 | $417,933 |
| 2016 | $7,930 | $562,099 | $152,360 | $409,739 |
| 2015 | $7,832 | $553,657 | $150,072 | $403,585 |
| 2014 | $7,720 | $542,813 | $147,133 | $395,680 |
Source: Public Records
Map
Nearby Homes
- 11954 Cypress Valley Dr
- 11793 Alderhill Terrace
- 11495 Cypress Canyon Rd
- 12432 Caminito Brioso
- 11721 Treadwell Dr
- 10976 Caminito Alto
- 12026 Medoc Ln
- 11964 Ashley Place
- 11766 Treadwell Dr
- 11393 Vista Elevada
- 10616 Falcon Rim Point
- 10575 Spruce Grove Ave
- 10941 Waterton Rd
- 10405 White Birch Dr
- 10304 Spruce Grove Ave
- 10818 Caminito Arcada
- 10415 Mesa Madera Dr
- 11787 La Colina Rd
- 11553 Trailbrook Ln Unit 2
- 11590 Trailbrook Ln
- 11298 Pepperview Terrace
- 11306 Pepperview Terrace
- 11294 Pepperview Terrace
- 11316 Pepperview Terrace
- 11290 Pepperview Terrace
- 11310 Pepperview Terrace
- 11305 Pepperview Terrace
- 11322 Pepperview Terrace
- 11286 Pepperview Terrace
- 11311 Pepperview Terrace
- 11855 Sweetbriar Ln
- 11328 Pepperview Terrace
- 11327 Pepperview Terrace
- 11282 Pepperview Terrace
- 11863 Sweetbriar Ln
- 11860 Sweetbriar Ln
- 11334 Pepperview Terrace
- 11278 Pepperview Terrace
- 11407 Elmstone Ct
- 11339 Pepperview Terrace