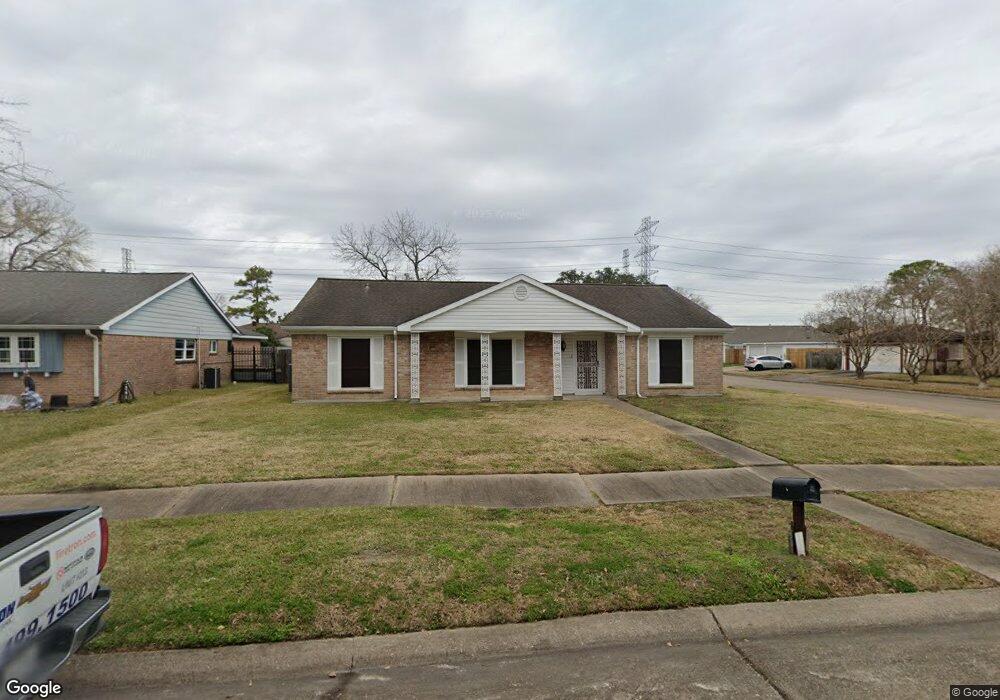
11302 Sharpview Dr Houston, TX 77072
Alief NeighborhoodEstimated Value: $220,719 - $243,000
3
Beds
2
Baths
1,621
Sq Ft
$141/Sq Ft
Est. Value
About This Home
This home is located at 11302 Sharpview Dr, Houston, TX 77072 and is currently estimated at $228,930, approximately $141 per square foot. 11302 Sharpview Dr is a home located in Harris County with nearby schools including Martin Elementary School, Owens Intermediate School, and Hastings High School.
Ownership History
Date
Name
Owned For
Owner Type
Purchase Details
Closed on
Mar 6, 2023
Sold by
Huynh Xau and Huynh Quyen Thi
Bought by
Nguyen Loan Su Yen
Current Estimated Value
Home Financials for this Owner
Home Financials are based on the most recent Mortgage that was taken out on this home.
Original Mortgage
$165,000
Outstanding Balance
$29,651
Interest Rate
6.15%
Mortgage Type
New Conventional
Estimated Equity
$199,279
Purchase Details
Closed on
Oct 13, 2006
Sold by
Little Joseph B and Little Patricia L
Bought by
Huynh Xau and Pham Quyen Thi
Home Financials for this Owner
Home Financials are based on the most recent Mortgage that was taken out on this home.
Original Mortgage
$94,400
Interest Rate
6.46%
Mortgage Type
Purchase Money Mortgage
Purchase Details
Closed on
Jan 16, 2006
Sold by
Little Joseph B and Little Patricia L
Bought by
Little Joseph B and Little Patricia L
Purchase Details
Closed on
Aug 2, 1994
Sold by
Stamm Murray Raymond and Stamm Marilyn Arnoult
Bought by
Little Joseph B and Little Patricia L
Create a Home Valuation Report for This Property
The Home Valuation Report is an in-depth analysis detailing your home's value as well as a comparison with similar homes in the area
Home Values in the Area
Average Home Value in this Area
Purchase History
| Date | Buyer | Sale Price | Title Company |
|---|---|---|---|
| Nguyen Loan Su Yen | -- | Chicago Title Company | |
| Huynh Xau | -- | First American Title | |
| Little Joseph B | -- | None Available | |
| Little Joseph B | -- | -- |
Source: Public Records
Mortgage History
| Date | Status | Borrower | Loan Amount |
|---|---|---|---|
| Open | Nguyen Loan Su Yen | $165,000 | |
| Previous Owner | Huynh Xau | $94,400 |
Source: Public Records
Tax History
| Year | Tax Paid | Tax Assessment Tax Assessment Total Assessment is a certain percentage of the fair market value that is determined by local assessors to be the total taxable value of land and additions on the property. | Land | Improvement |
|---|---|---|---|---|
| 2025 | $3,089 | $201,054 | $61,243 | $139,811 |
| 2024 | $3,089 | $203,792 | $61,243 | $142,549 |
| 2023 | $3,089 | $204,139 | $61,243 | $142,896 |
| 2022 | $3,917 | $185,828 | $46,833 | $138,995 |
| 2021 | $3,583 | $146,784 | $36,025 | $110,759 |
| 2020 | $3,518 | $143,107 | $36,025 | $107,082 |
| 2019 | $3,482 | $126,458 | $25,218 | $101,240 |
| 2018 | $944 | $122,534 | $25,218 | $97,316 |
| 2017 | $3,141 | $115,187 | $21,615 | $93,572 |
| 2016 | $3,057 | $112,112 | $21,615 | $90,497 |
| 2015 | $925 | $112,112 | $21,615 | $90,497 |
| 2014 | $925 | $99,919 | $21,615 | $78,304 |
Source: Public Records
Map
Nearby Homes
- 11434 Sharpview Dr
- 11623 Rowan Ln
- 11807 Sharpview Dr
- 11807 Stroud Dr
- 11222 Langdon Ln
- 11039 Holworth Dr
- 11136 Village Bend Ln Unit 1136
- 10711 Sharpview Dr
- 11247 Langdon Ln
- 11169 Village Bend Ln Unit 1169
- 11315 Langdon Ln
- 11030 Holworth Dr
- 11110 Petworth Dr
- 6955 Turtlewood Dr Unit 602
- 6955 Turtlewood Dr Unit 502
- 6955 Turtlewood Dr Unit 607
- 10920 Village Bend Ln Unit 920
- 10555 Turtlewood Ct Unit 414
- 10555 Turtlewood Ct Unit 511
- 10555 Turtlewood Ct Unit 2802
- 11306 Sharpview Dr
- 11303 Stroud Dr
- 11230 Sharpview Dr
- 11307 Stroud Dr
- 11310 Sharpview Dr
- 11303 Sharpview Dr
- 11239 Stroud Dr
- 11311 Stroud Dr
- 11307 Sharpview Dr
- 11226 Sharpview Dr
- 11314 Sharpview Dr
- 11231 Sharpview Dr
- 11311 Sharpview Dr
- 11235 Stroud Dr
- 11315 Stroud Dr
- 11227 Sharpview Dr
- 11222 Sharpview Dr
- 11315 Sharpview Dr
- 11318 Sharpview Dr
- 11302 Sandstone St
Your Personal Tour Guide
Ask me questions while you tour the home.