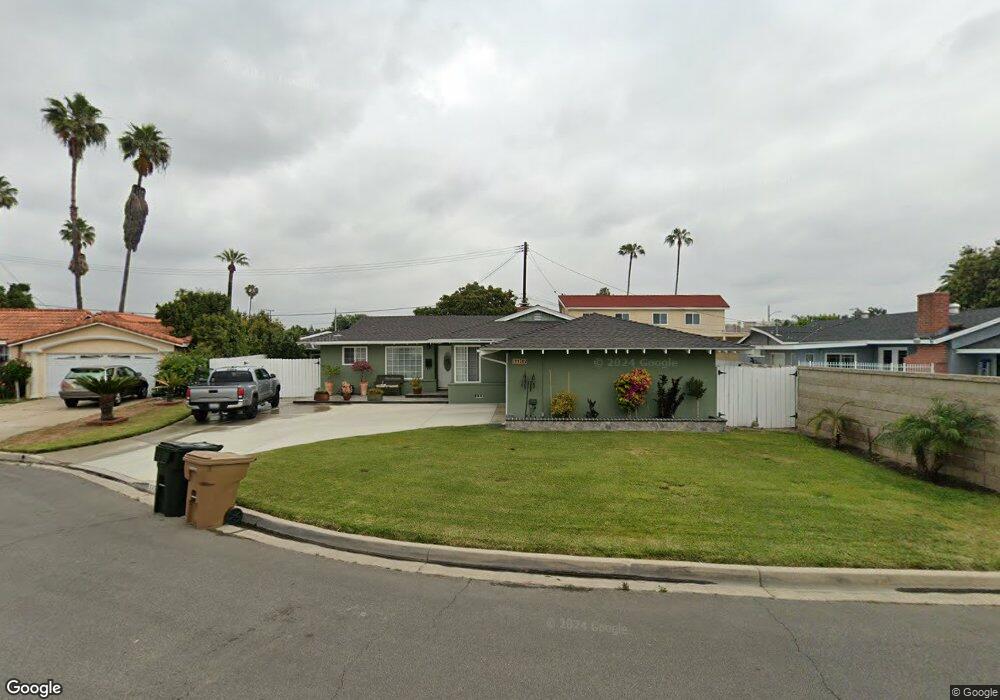
11302 Songish St Garden Grove, CA 92840
Estimated Value: $920,955 - $1,104,000
3
Beds
2
Baths
1,284
Sq Ft
$767/Sq Ft
Est. Value
About This Home
This home is located at 11302 Songish St, Garden Grove, CA 92840 and is currently estimated at $984,489, approximately $766 per square foot. 11302 Songish St is a home located in Orange County with nearby schools including Faylane Elementary School, Lake Intermediate School, and Rancho Alamitos High School.
Ownership History
Date
Name
Owned For
Owner Type
Purchase Details
Closed on
Mar 12, 2020
Sold by
Bello Miguel A Lo and Bello Connie L
Bought by
2016 Lobello Living Trust
Current Estimated Value
Purchase Details
Closed on
Sep 8, 2009
Sold by
Lo Bello Miguel A and Lo Bello Connie L
Bought by
Lo Bello Miguel A and Lo Bello Connie L
Home Financials for this Owner
Home Financials are based on the most recent Mortgage that was taken out on this home.
Original Mortgage
$130,000
Outstanding Balance
$85,278
Interest Rate
5.25%
Mortgage Type
New Conventional
Estimated Equity
$899,211
Purchase Details
Closed on
Oct 9, 1996
Sold by
Johnson Jerrey H and Johnson Elizabeth A
Bought by
Lobello Miguel A and Lobello Connie L
Home Financials for this Owner
Home Financials are based on the most recent Mortgage that was taken out on this home.
Original Mortgage
$142,494
Interest Rate
7.88%
Mortgage Type
FHA
Purchase Details
Closed on
Oct 1, 1994
Sold by
Johnson Jerrey H
Bought by
Johnson Jerrey H
Create a Home Valuation Report for This Property
The Home Valuation Report is an in-depth analysis detailing your home's value as well as a comparison with similar homes in the area
Home Values in the Area
Average Home Value in this Area
Purchase History
| Date | Buyer | Sale Price | Title Company |
|---|---|---|---|
| 2016 Lobello Living Trust | -- | None Available | |
| Lo Bello Miguel A | -- | Landsafe Title | |
| Lobello Miguel A | $145,000 | Southland Title Corp | |
| Johnson Jerrey H | -- | -- |
Source: Public Records
Mortgage History
| Date | Status | Borrower | Loan Amount |
|---|---|---|---|
| Open | Lo Bello Miguel A | $130,000 | |
| Closed | Lobello Miguel A | $142,494 |
Source: Public Records
Tax History Compared to Growth
Tax History
| Year | Tax Paid | Tax Assessment Tax Assessment Total Assessment is a certain percentage of the fair market value that is determined by local assessors to be the total taxable value of land and additions on the property. | Land | Improvement |
|---|---|---|---|---|
| 2025 | $3,051 | $236,149 | $150,917 | $85,232 |
| 2024 | $3,051 | $231,519 | $147,958 | $83,561 |
| 2023 | $2,990 | $226,980 | $145,057 | $81,923 |
| 2022 | $2,941 | $222,530 | $142,213 | $80,317 |
| 2021 | $2,910 | $218,167 | $139,424 | $78,743 |
| 2020 | $2,877 | $215,930 | $137,994 | $77,936 |
| 2019 | $2,810 | $211,697 | $135,289 | $76,408 |
| 2018 | $2,764 | $207,547 | $132,637 | $74,910 |
| 2017 | $2,725 | $203,478 | $130,036 | $73,442 |
| 2016 | $2,596 | $199,489 | $127,487 | $72,002 |
| 2015 | $2,563 | $196,493 | $125,572 | $70,921 |
| 2014 | $2,477 | $192,644 | $123,112 | $69,532 |
Source: Public Records
Map
Nearby Homes
- 10136 Montecito Plaza
- 10111 Dewey Dr
- 10112 Becca Dr
- 11401 Tobie St
- 9881 Aldgate Ave
- 10221 Roselee Dr
- 9901 Royal Palm Blvd
- 1737 S Garden Dr
- 10072 Roselee Dr
- 1765 S Biscayne Ct
- 9762 Gamble Ave
- 10622 Tibbs Cir
- 2011 W Katella Ave Unit 61
- 10691 Perrin Dr
- 11441 Dolan St
- 11421 Barclay Dr
- 11762 Gary St
- 2273 W Judith Ln
- 11912 Brookhaven St Unit 65
- 11301 Euclid St Unit 60
- 10211 Parliament Ave
- 11292 Songish St
- 11291 Stratford Way
- 11311 Stratford Way
- 11286 Songish St
- 11281 Stratford Way
- 11301 Songish St
- 10191 Parliament Ave
- 11291 Songish St
- 10202 Brookside Dr
- 10202 Parliament Ave
- 10222 Parliament Ave
- 10222 Brookside Dr
- 10192 Brookside Dr
- 10232 Brookside Dr
- 10192 Parliament Ave
- 10232 Parliament Ave
- 11302 Garden Dr
- 11292 Stratford Way
- 10182 Brookside Dr