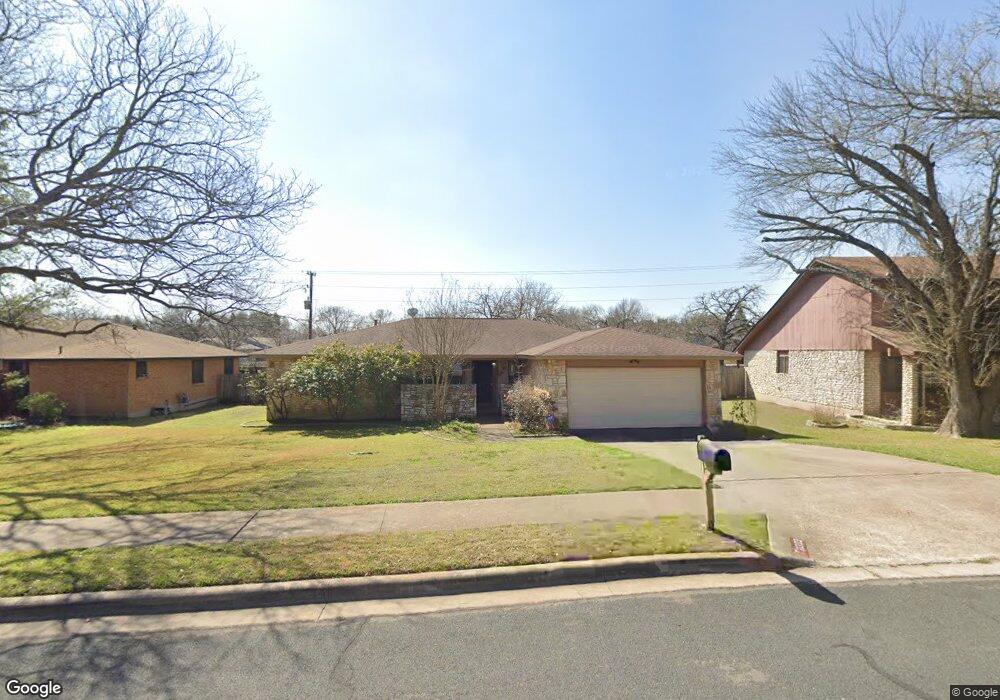
11303 Thorny Brook Trail Austin, TX 78750
Anderson Mill NeighborhoodEstimated Value: $404,000 - $449,000
3
Beds
2
Baths
1,721
Sq Ft
$242/Sq Ft
Est. Value
About This Home
This home is located at 11303 Thorny Brook Trail, Austin, TX 78750 and is currently estimated at $417,086, approximately $242 per square foot. 11303 Thorny Brook Trail is a home located in Williamson County with nearby schools including Purple Sage Elementary School, Noel Grisham Middle, and Westwood High School.
Ownership History
Date
Name
Owned For
Owner Type
Purchase Details
Closed on
May 10, 2013
Sold by
Gandy Regina M and Williams Regina M
Bought by
Williams Clifford T and Williams Regina M
Current Estimated Value
Home Financials for this Owner
Home Financials are based on the most recent Mortgage that was taken out on this home.
Original Mortgage
$155,800
Outstanding Balance
$33,888
Interest Rate
3.45%
Mortgage Type
New Conventional
Estimated Equity
$383,198
Purchase Details
Closed on
May 12, 2006
Sold by
H Thompson Investment Inc
Bought by
Gandy Regina M
Home Financials for this Owner
Home Financials are based on the most recent Mortgage that was taken out on this home.
Original Mortgage
$127,637
Interest Rate
6.5%
Mortgage Type
Purchase Money Mortgage
Purchase Details
Closed on
Dec 19, 2005
Sold by
Household Finance Corp Iii
Bought by
H Thompson Investments Inc
Purchase Details
Closed on
Sep 6, 2005
Sold by
Mortgage Electronic Registration System
Bought by
Household Finance Corp Iii
Create a Home Valuation Report for This Property
The Home Valuation Report is an in-depth analysis detailing your home's value as well as a comparison with similar homes in the area
Home Values in the Area
Average Home Value in this Area
Purchase History
| Date | Buyer | Sale Price | Title Company |
|---|---|---|---|
| Williams Clifford T | -- | None Available | |
| Gandy Regina M | -- | Landamerica Commonwealth Tit | |
| H Thompson Investments Inc | -- | Fidelity National Title Comp | |
| Household Finance Corp Iii | -- | None Available |
Source: Public Records
Mortgage History
| Date | Status | Borrower | Loan Amount |
|---|---|---|---|
| Open | Williams Clifford T | $155,800 | |
| Closed | Gandy Regina M | $127,637 |
Source: Public Records
Tax History Compared to Growth
Tax History
| Year | Tax Paid | Tax Assessment Tax Assessment Total Assessment is a certain percentage of the fair market value that is determined by local assessors to be the total taxable value of land and additions on the property. | Land | Improvement |
|---|---|---|---|---|
| 2025 | $6,137 | $388,327 | $88,500 | $299,827 |
| 2024 | $6,137 | $375,791 | $88,500 | $287,291 |
| 2023 | $6,206 | $385,513 | $0 | $0 |
| 2022 | $6,618 | $350,466 | $0 | $0 |
| 2021 | $7,827 | $318,605 | $72,000 | $270,824 |
| 2020 | $6,891 | $289,641 | $66,598 | $223,043 |
| 2019 | $7,044 | $287,978 | $60,700 | $227,278 |
| 2018 | $6,016 | $266,971 | $54,891 | $212,080 |
| 2017 | $6,139 | $245,941 | $51,300 | $217,904 |
| 2016 | $5,581 | $223,583 | $51,300 | $201,161 |
| 2015 | $4,456 | $203,257 | $42,100 | $181,695 |
| 2014 | $4,456 | $184,779 | $0 | $0 |
Source: Public Records
Map
Nearby Homes
- 12206 Saber Trail
- 12106 Grey Fawn Path
- 11908 Stout Oak Trail
- 11405 Bristle Oak Trail
- 11512 Powder Mill Trail
- 11506 Powder Mill Trail
- 11010 Froke Cedar Trail
- 11611 Quarter Horse Trail
- 11811 Buggy Whip Trail
- 1028 Verbena Dr
- 10902 Hard Rock Rd
- 11700 Aloe Vera Cove
- 12306 Split Rail Pkwy
- 11007 Opal Trail
- 11100 Alison Parke Trail
- 11462 Bristle Oak Trail
- 12300 Wipple Tree Cove
- 11612 Tanglebriar Trail
- 1502 Glen Burnie Dr
- 11000 Anderson Mill Rd Unit 96
- 11305 Thorny Brook Trail
- 11307 Thorny Brook Trail
- 11215 Thorny Brook Trail
- 11302 Thorny Brook Trail
- 11300 Thorny Brook Trail
- 11304 Thorny Brook Trail
- 11212 Thorny Brook Trail
- 12108 Mill Hollow
- 11309 Thorny Brook Trail
- 11213 Thorny Brook Trail
- 11301 Bristle Oak Trail
- 11306 Thorny Brook Trail
- 12111 Mill Hollow
- 12106 Mill Hollow
- 11237 Timbrook Trail
- 11301 Timbrook Trail
- 11210 Thorny Brook Trail
- 11235 Timbrook Trail
- 11311 Thorny Brook Trail
- 12109 Mill Hollow