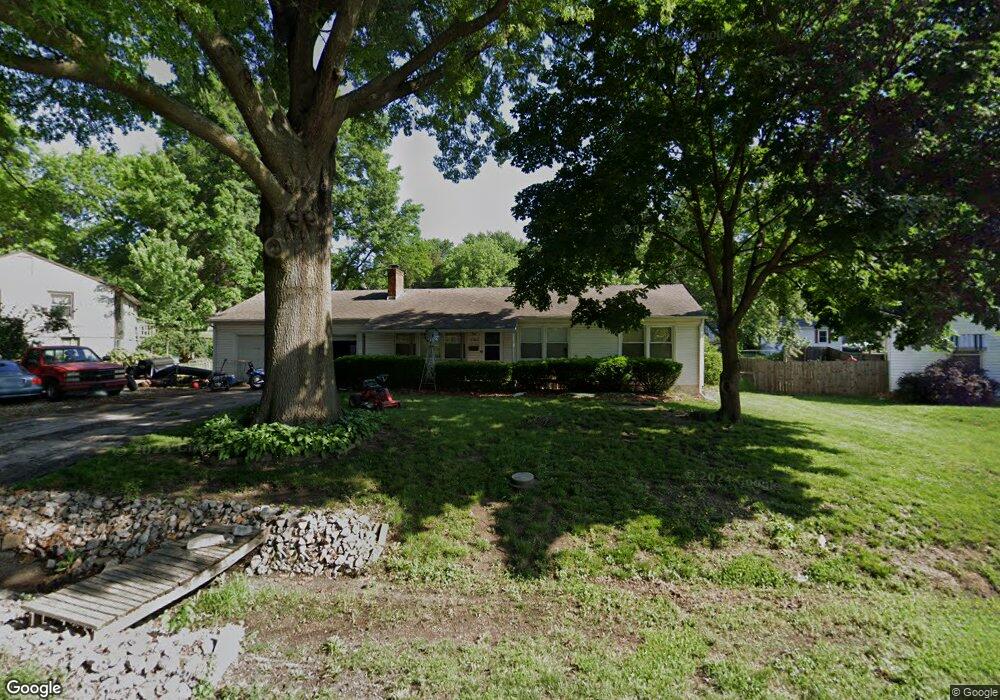
11304 E 47th St Kansas City, MO 64133
Sterling NeighborhoodEstimated Value: $211,000 - $218,000
3
Beds
3
Baths
1,080
Sq Ft
$199/Sq Ft
Est. Value
About This Home
This home is located at 11304 E 47th St, Kansas City, MO 64133 and is currently estimated at $215,397, approximately $199 per square foot. 11304 E 47th St is a home located in Jackson County with nearby schools including Little Blue Elementary School, Raytown Middle School, and Raytown South High School.
Ownership History
Date
Name
Owned For
Owner Type
Purchase Details
Closed on
Sep 27, 2024
Sold by
Lee Shannon
Bought by
Aa Property Llc
Current Estimated Value
Home Financials for this Owner
Home Financials are based on the most recent Mortgage that was taken out on this home.
Original Mortgage
$148,000
Outstanding Balance
$146,333
Interest Rate
6.46%
Mortgage Type
New Conventional
Estimated Equity
$69,064
Purchase Details
Closed on
Aug 11, 2000
Sold by
Shanks Dennis A and Shanks Lynda L
Bought by
Lee Shannon D
Home Financials for this Owner
Home Financials are based on the most recent Mortgage that was taken out on this home.
Original Mortgage
$78,959
Interest Rate
8.21%
Mortgage Type
FHA
Purchase Details
Closed on
Nov 19, 1997
Sold by
Shanks Dennis A and Shanks Lynda L
Bought by
Shanks Loree N and Shanks Cody A
Create a Home Valuation Report for This Property
The Home Valuation Report is an in-depth analysis detailing your home's value as well as a comparison with similar homes in the area
Home Values in the Area
Average Home Value in this Area
Purchase History
| Date | Buyer | Sale Price | Title Company |
|---|---|---|---|
| Aa Property Llc | $85,000 | None Listed On Document | |
| Aa Property Llc | $85,000 | None Listed On Document | |
| Lee Shannon D | -- | Guaranty Land Title Insuranc | |
| Shanks Loree N | -- | -- |
Source: Public Records
Mortgage History
| Date | Status | Borrower | Loan Amount |
|---|---|---|---|
| Open | Aa Property Llc | $148,000 | |
| Closed | Aa Property Llc | $148,000 | |
| Previous Owner | Lee Shannon D | $78,959 |
Source: Public Records
Tax History Compared to Growth
Tax History
| Year | Tax Paid | Tax Assessment Tax Assessment Total Assessment is a certain percentage of the fair market value that is determined by local assessors to be the total taxable value of land and additions on the property. | Land | Improvement |
|---|---|---|---|---|
| 2025 | $2,553 | $25,378 | $5,474 | $19,904 |
| 2024 | $2,537 | $28,211 | $4,741 | $23,470 |
| 2023 | $2,537 | $28,211 | $3,338 | $24,873 |
| 2022 | $1,795 | $19,190 | $3,772 | $15,418 |
| 2021 | $1,795 | $19,190 | $3,772 | $15,418 |
| 2020 | $1,725 | $18,225 | $3,772 | $14,453 |
| 2019 | $1,693 | $18,225 | $3,772 | $14,453 |
| 2018 | $1,591 | $17,203 | $4,696 | $12,507 |
| 2017 | $1,541 | $17,203 | $4,696 | $12,507 |
| 2016 | $1,541 | $16,772 | $3,327 | $13,445 |
| 2014 | $1,501 | $16,283 | $3,230 | $13,053 |
Source: Public Records
Map
Nearby Homes
- 11219 E 47th Terrace
- 11717 E 45th Terrace
- 11208 E 45th St
- 11312 E 48th Terrace
- 4521 Moats Ave E
- 11406 E 49th St
- 4541 Appleton Ave
- 4537 Appleton Ave
- 11309 E 49th St
- 4900 Norwood Ave
- 4500 Harvard Ln
- 4605 Appleton Ave
- 4718 Appleton Ave
- 10720 E 46th Terrace
- 10721 E 46th Terrace
- 10717 E 46th Terrace
- 11911 E 44th St
- 10719 E 46th Terrace
- 4534 Appleton Ave
- 4615 Appleton Ave
- 11308 E 47th St
- 11300 E 47th St
- 4604 Vermont Ave
- 4605 Claremont Ave
- 11305 E 47th St
- 4600 Vermont Ave
- 11309 E 47th St
- 4601 Claremont Ave
- 4605 Vermont Ave
- 4520 Vermont Ave
- 4707 Claremont Ave
- 4519 Claremont Ave
- 4601 Vermont Ave
- 4706 Vermont Ave
- 4701 Vermont Ave
- 11225 E 47th St
- 4622 Norwood Ct
- 4523 Vermont Ave
- 4516 Vermont Ave
- 4711 Claremont Ave