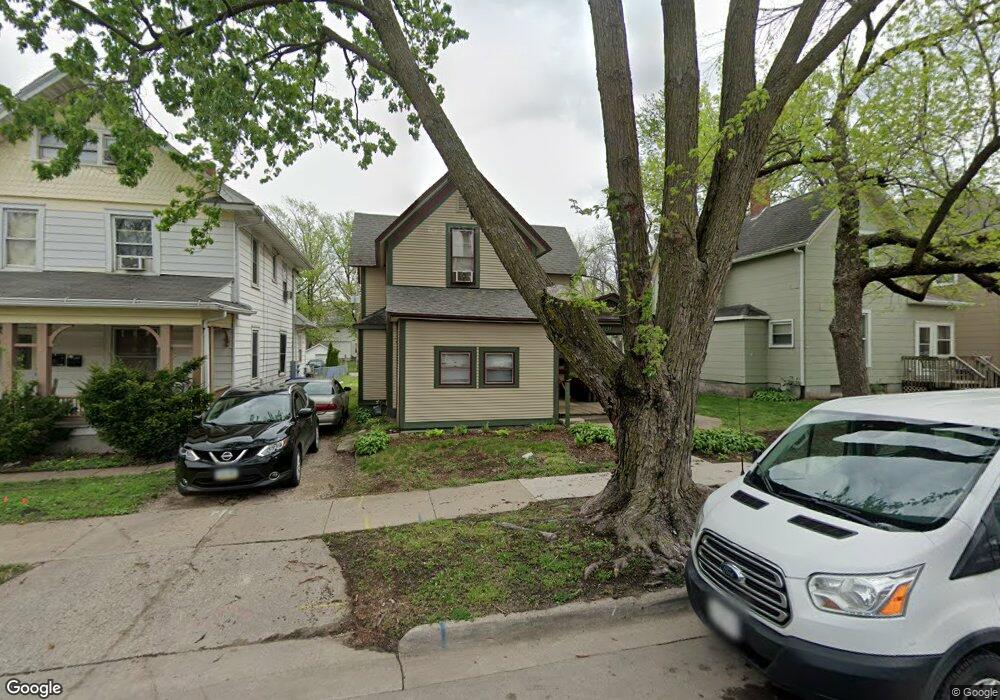
1131 24th St Des Moines, IA 50311
Drake NeighborhoodEstimated Value: $104,488 - $141,000
5
Beds
2
Baths
1,571
Sq Ft
$78/Sq Ft
Est. Value
About This Home
This home is located at 1131 24th St, Des Moines, IA 50311 and is currently estimated at $122,744, approximately $78 per square foot. 1131 24th St is a home located in Polk County with nearby schools including Roosevelt High School.
Ownership History
Date
Name
Owned For
Owner Type
Purchase Details
Closed on
Feb 10, 2014
Sold by
Schmidt John Mark
Bought by
Schmidt Peter A and Schmidt John Mark
Current Estimated Value
Purchase Details
Closed on
Apr 13, 2012
Sold by
Jahnke Paul H
Bought by
Ingrid Schmidt Revocable Trust
Purchase Details
Closed on
Apr 30, 2002
Sold by
Sutton Robert R and Sutton Carol V
Bought by
Jahnke Paul H
Home Financials for this Owner
Home Financials are based on the most recent Mortgage that was taken out on this home.
Original Mortgage
$36,125
Interest Rate
8.62%
Mortgage Type
Commercial
Create a Home Valuation Report for This Property
The Home Valuation Report is an in-depth analysis detailing your home's value as well as a comparison with similar homes in the area
Home Values in the Area
Average Home Value in this Area
Purchase History
| Date | Buyer | Sale Price | Title Company |
|---|---|---|---|
| Schmidt Peter A | -- | None Available | |
| Ingrid Schmidt Revocable Trust | $51,000 | Itc | |
| Jahnke Paul H | $42,000 | -- |
Source: Public Records
Mortgage History
| Date | Status | Borrower | Loan Amount |
|---|---|---|---|
| Previous Owner | Jahnke Paul H | $36,125 |
Source: Public Records
Tax History Compared to Growth
Tax History
| Year | Tax Paid | Tax Assessment Tax Assessment Total Assessment is a certain percentage of the fair market value that is determined by local assessors to be the total taxable value of land and additions on the property. | Land | Improvement |
|---|---|---|---|---|
| 2025 | $2,794 | $164,100 | $32,400 | $131,700 |
| 2024 | $2,794 | $142,000 | $27,900 | $114,100 |
| 2023 | $1,994 | $142,000 | $27,900 | $114,100 |
| 2022 | $1,978 | $107,100 | $22,500 | $84,600 |
| 2021 | $1,798 | $107,100 | $22,500 | $84,600 |
| 2020 | $1,868 | $94,600 | $20,000 | $74,600 |
| 2019 | $1,736 | $94,600 | $20,000 | $74,600 |
| 2018 | $1,718 | $87,100 | $12,800 | $74,300 |
| 2017 | $1,538 | $87,100 | $12,800 | $74,300 |
| 2016 | $1,498 | $79,400 | $11,600 | $67,800 |
| 2015 | $1,498 | $79,400 | $11,600 | $67,800 |
| 2014 | $1,366 | $73,900 | $10,800 | $63,100 |
Source: Public Records
Map
Nearby Homes