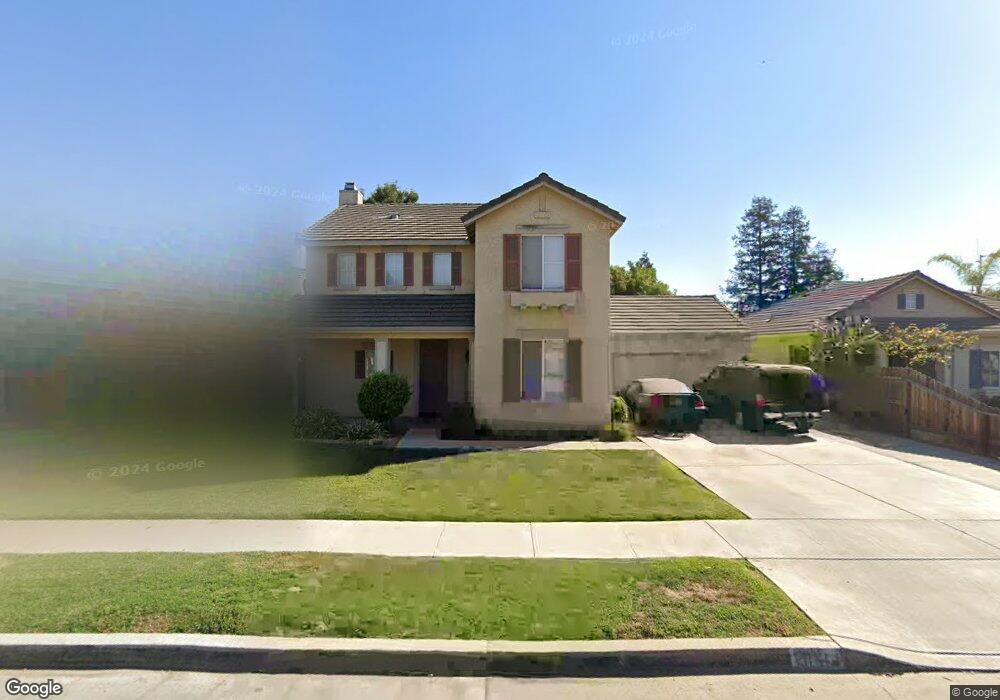
1131 Dolcetto Ct Tulare, CA 93274
Northeast Tulare NeighborhoodEstimated Value: $394,167 - $463,000
4
Beds
3
Baths
1,952
Sq Ft
$221/Sq Ft
Est. Value
About This Home
This home is located at 1131 Dolcetto Ct, Tulare, CA 93274 and is currently estimated at $431,292, approximately $220 per square foot. 1131 Dolcetto Ct is a home located in Tulare County with nearby schools including Mission Valley Elementary School, Live Oak Middle School, and Tulare Union High School.
Ownership History
Date
Name
Owned For
Owner Type
Purchase Details
Closed on
Feb 27, 2013
Sold by
Homem Jack C
Bought by
Homem Jack C
Current Estimated Value
Home Financials for this Owner
Home Financials are based on the most recent Mortgage that was taken out on this home.
Original Mortgage
$92,010
Outstanding Balance
$64,900
Interest Rate
3.53%
Mortgage Type
New Conventional
Estimated Equity
$366,392
Purchase Details
Closed on
Jan 27, 2003
Sold by
Homem Crystal
Bought by
Homem Jack C
Purchase Details
Closed on
Dec 18, 2001
Sold by
Homem Georgina
Bought by
Homem Joaquin and Homem Georgina
Purchase Details
Closed on
Feb 28, 2001
Sold by
Homem Joaquin V
Bought by
Homem Georgina
Purchase Details
Closed on
Aug 1, 2000
Sold by
The Craftsman Collection At Del Lago Llc
Bought by
Homem Georgina
Home Financials for this Owner
Home Financials are based on the most recent Mortgage that was taken out on this home.
Original Mortgage
$117,712
Interest Rate
6.98%
Create a Home Valuation Report for This Property
The Home Valuation Report is an in-depth analysis detailing your home's value as well as a comparison with similar homes in the area
Home Values in the Area
Average Home Value in this Area
Purchase History
| Date | Buyer | Sale Price | Title Company |
|---|---|---|---|
| Homem Jack C | -- | Multiple | |
| Homem Jack C | -- | First American Title Co | |
| Homem Joaquin | -- | -- | |
| Homem Georgina | -- | Chicago Title Co | |
| Homem Georgina | $147,500 | Chicago Title Co |
Source: Public Records
Mortgage History
| Date | Status | Borrower | Loan Amount |
|---|---|---|---|
| Open | Homem Jack C | $92,010 | |
| Previous Owner | Homem Georgina | $117,712 |
Source: Public Records
Tax History Compared to Growth
Tax History
| Year | Tax Paid | Tax Assessment Tax Assessment Total Assessment is a certain percentage of the fair market value that is determined by local assessors to be the total taxable value of land and additions on the property. | Land | Improvement |
|---|---|---|---|---|
| 2025 | $2,747 | $221,517 | $45,210 | $176,307 |
| 2024 | $2,747 | $217,174 | $44,324 | $172,850 |
| 2023 | $2,686 | $212,916 | $43,455 | $169,461 |
| 2022 | $2,617 | $208,742 | $42,603 | $166,139 |
| 2021 | $2,572 | $204,649 | $41,768 | $162,881 |
| 2020 | $2,590 | $202,551 | $41,340 | $161,211 |
| 2019 | $2,597 | $198,579 | $40,529 | $158,050 |
| 2018 | $2,509 | $194,685 | $39,734 | $154,951 |
| 2017 | $2,482 | $190,868 | $38,955 | $151,913 |
| 2016 | $2,382 | $187,125 | $38,191 | $148,934 |
| 2015 | $2,309 | $184,314 | $37,617 | $146,697 |
| 2014 | $2,309 | $180,703 | $36,880 | $143,823 |
Source: Public Records
Map
Nearby Homes
- 947 Lisbon Ave
- 939 Lisbon Ave
- 923 Lisbon Ave
- 1121 Zinfandel Ct
- 1768 Maduro Ct
- 1249 Bargetto Ct
- 1734 Firestone Dr
- 0 N Cherry St Unit 234532
- 0 N Cherry St Unit 234531
- 1563 E Glenwood Ave
- 1280 E Richard Smith Ave
- 1618 Glen Ellen Ct
- 1222 N Laspina St
- 2673 Clarete St
- 1579 Monsecco St
- 1205 Jamestown St
- 1282 E Ben Franklin Ave
- 2012 Diamante Dr
- 1160 N Laspina St
- 0 E Cartmill Ave
- 1119 Dolcetto Ct
- 1149 Dolcetto Ct
- 1163 Dolcetto Ct
- 1113 Dolcetto Ct
- 1136 Dolcetto Ct
- 1122 Dolcetto Ct
- 1108 Leland Ave
- 1158 Dolcetto Ct
- 1175 Dolcetto Ct
- 1111 Dolcetto Ct
- 1114 Dolcetto Ct
- 1100 Dolcetto Ct
- 1170 Dolcetto Ct
- 1156 Leland Ave
- 1181 Dolcetto Ct
- 1135 Chardonnay Ct
- 1147 Chardonnay Ct
- 1119 Chardonnay Ct
- 1119 Chardonnay Ave
- 1165 Chardonnay Ct