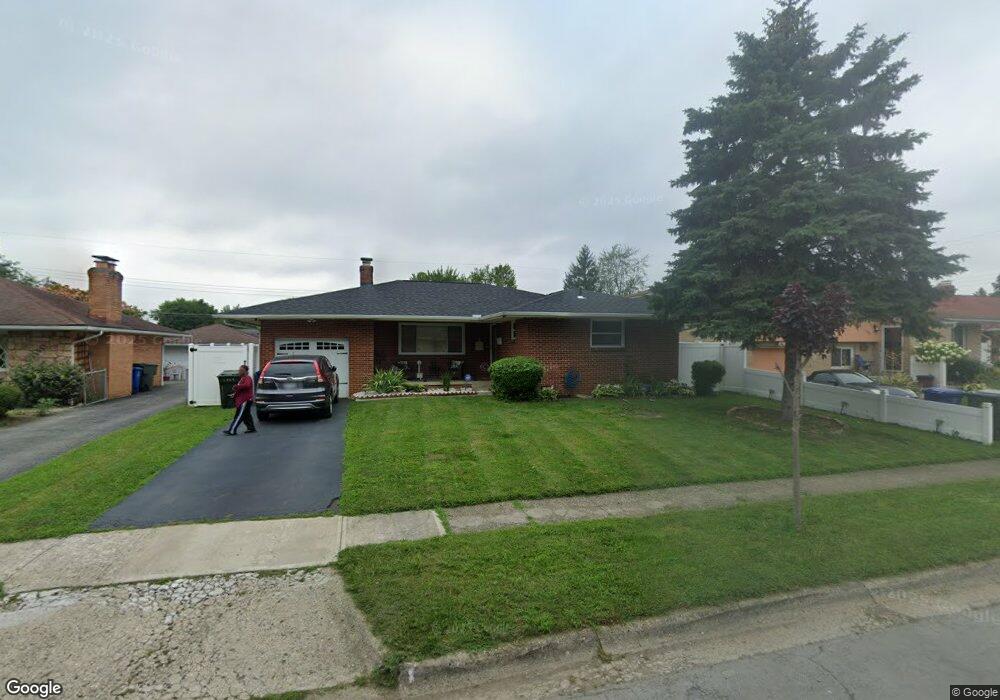
1131 Erickson Rd Columbus, OH 43227
Beechwood NeighborhoodEstimated Value: $224,000 - $295,000
4
Beds
2
Baths
1,531
Sq Ft
$166/Sq Ft
Est. Value
About This Home
This home is located at 1131 Erickson Rd, Columbus, OH 43227 and is currently estimated at $253,994, approximately $165 per square foot. 1131 Erickson Rd is a home located in Franklin County with nearby schools including Shady Lane Elementary School, Sherwood Middle School, and Walnut Ridge High School.
Ownership History
Date
Name
Owned For
Owner Type
Purchase Details
Closed on
Dec 19, 2025
Sold by
Zebib Makda and Abraham Askalu K
Bought by
Zebib Family Llc
Current Estimated Value
Purchase Details
Closed on
Jul 5, 2018
Sold by
Zebib Makda
Bought by
Zebib Makda and Abaham Askalu
Purchase Details
Closed on
May 15, 2018
Sold by
Zebib Zebib Makda Makda and Zebib Gidey
Bought by
Zebib Makda
Purchase Details
Closed on
Oct 25, 2017
Sold by
Zebib Abraham Askalu K and Zebib Gidey
Bought by
Gidey Zebib and Zebib Makda
Purchase Details
Closed on
Apr 9, 2004
Sold by
Hill Benson Edward and The Estate Of Mary Hill Benson
Bought by
Gidey Zebib and Abraham Askalu K
Home Financials for this Owner
Home Financials are based on the most recent Mortgage that was taken out on this home.
Original Mortgage
$110,200
Interest Rate
5.66%
Mortgage Type
Purchase Money Mortgage
Purchase Details
Closed on
Mar 23, 1987
Bought by
Benson Mary H
Create a Home Valuation Report for This Property
The Home Valuation Report is an in-depth analysis detailing your home's value as well as a comparison with similar homes in the area
Home Values in the Area
Average Home Value in this Area
Purchase History
| Date | Buyer | Sale Price | Title Company |
|---|---|---|---|
| Zebib Family Llc | -- | None Listed On Document | |
| Zebib Makda | -- | Transcounty Title Box | |
| Zebib Makda | -- | Transcounty Title Agency Llc | |
| Gidey Zebib | -- | Transcounty Title Agency Llc | |
| Gidey Zebib | $116,000 | Independent Title | |
| Benson Mary H | -- | -- |
Source: Public Records
Mortgage History
| Date | Status | Borrower | Loan Amount |
|---|---|---|---|
| Previous Owner | Gidey Zebib | $110,200 |
Source: Public Records
Tax History
| Year | Tax Paid | Tax Assessment Tax Assessment Total Assessment is a certain percentage of the fair market value that is determined by local assessors to be the total taxable value of land and additions on the property. | Land | Improvement |
|---|---|---|---|---|
| 2025 | $3,797 | $84,600 | $14,700 | $69,900 |
| 2024 | $3,797 | $84,600 | $14,700 | $69,900 |
| 2023 | $3,748 | $84,595 | $14,700 | $69,895 |
| 2022 | $2,356 | $45,430 | $6,300 | $39,130 |
| 2021 | $2,360 | $45,430 | $6,300 | $39,130 |
| 2020 | $2,363 | $45,430 | $6,300 | $39,130 |
| 2019 | $2,238 | $36,890 | $5,040 | $31,850 |
| 2018 | $2,023 | $36,890 | $5,040 | $31,850 |
| 2017 | $2,117 | $36,890 | $5,040 | $31,850 |
| 2016 | $1,997 | $30,140 | $5,220 | $24,920 |
| 2015 | $1,812 | $30,140 | $5,220 | $24,920 |
| 2014 | $1,817 | $30,140 | $5,220 | $24,920 |
| 2013 | $1,054 | $35,455 | $6,125 | $29,330 |
Source: Public Records
Map
Nearby Homes
- 1275 Elaine Rd
- 963 Erickson Ave
- 1301 Bernhard Rd
- 957 Rose Place
- 3990 Astor Ave
- 3955 E Fulton St
- 4024 Colby Ave
- 1265 Elderwood Ave
- 1356 Harlow Rd
- 1085 S Hamilton Rd
- 1281 Maetzel Dr
- 1294 Dellwood Ave
- 798 S Yearling Rd
- 1469 Burlington Ave
- 1490 Elaine Rd Unit 1462
- 1269 Carolwood Ave
- 1492 Burlington Ave
- 1035 E Fulton St
- 1284 Thurston Dr
- 1001 Beechwood Rd
- 1123 Erickson Rd
- 1139 Erickson Rd
- 1124 Elaine Rd
- 1115 Erickson Rd
- 1147 Erickson Rd
- 1116 Elaine Rd
- 1132 Elaine Rd
- 1140 Erickson Ave
- 1132 Erickson Rd
- 1108 Elaine Rd
- 1140 Elaine Rd
- 1124 Erickson Ave
- 1140 Erickson Rd
- 1124 Erickson Rd
- 1155 Erickson Rd
- 1148 Erickson Ave
- 1148 Erickson Rd
- 4197 E Mound St
- 1148 Elaine Rd
- 4189 E Mound St
Your Personal Tour Guide
Ask me questions while you tour the home.