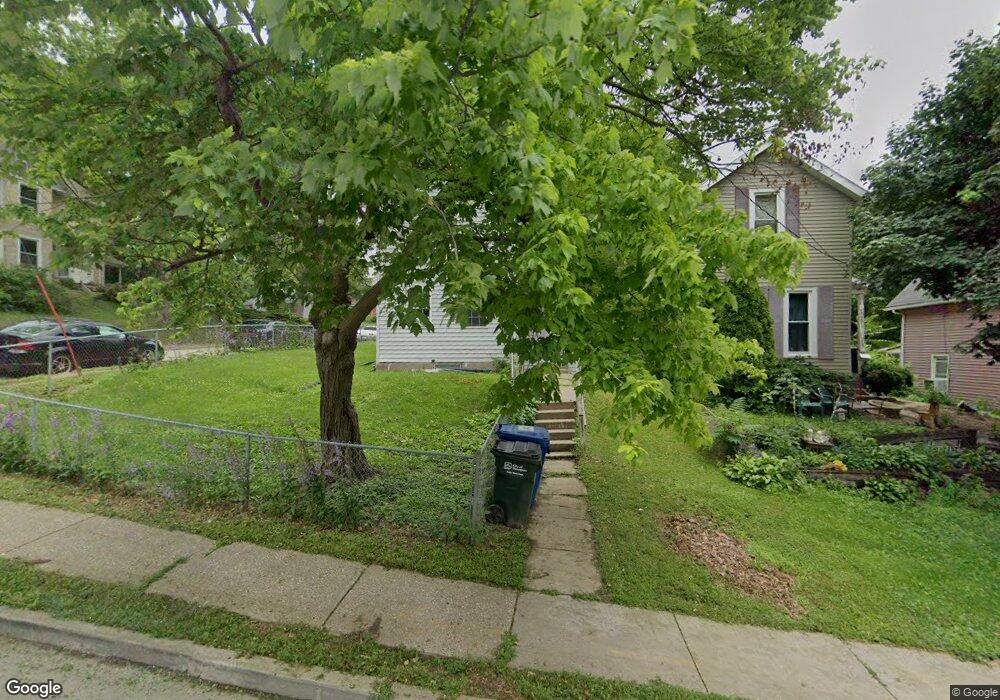
1131 Farnam St Davenport, IA 52803
Central Davenport NeighborhoodEstimated Value: $82,000 - $111,000
3
Beds
1
Bath
1,120
Sq Ft
$87/Sq Ft
Est. Value
About This Home
This home is located at 1131 Farnam St, Davenport, IA 52803 and is currently estimated at $96,990, approximately $86 per square foot. 1131 Farnam St is a home located in Scott County with nearby schools including Walnut Hill Elementary School, Crofton Elementary School, and Casey County Middle School.
Ownership History
Date
Name
Owned For
Owner Type
Purchase Details
Closed on
Mar 4, 2008
Sold by
Godfrey Christopher
Bought by
First Financial Group Lc
Current Estimated Value
Purchase Details
Closed on
Jul 31, 2006
Sold by
Caligiuri Lanny and Caligiuri Debbie
Bought by
Godfrey Christopher and Godfrey Elisama
Home Financials for this Owner
Home Financials are based on the most recent Mortgage that was taken out on this home.
Original Mortgage
$78,000
Interest Rate
9.12%
Mortgage Type
Adjustable Rate Mortgage/ARM
Purchase Details
Closed on
Oct 27, 2005
Sold by
Federal National Mortgage Association
Bought by
Caligiuri Lanny and Caligiuri Debbie
Purchase Details
Closed on
Oct 18, 2005
Sold by
Mortgage Electronic Registration System
Bought by
Federal National Mortgage Association
Purchase Details
Closed on
Jun 29, 2005
Sold by
Kirk Coleman E
Bought by
Mortgage Electronic Registration Systems
Create a Home Valuation Report for This Property
The Home Valuation Report is an in-depth analysis detailing your home's value as well as a comparison with similar homes in the area
Home Values in the Area
Average Home Value in this Area
Purchase History
| Date | Buyer | Sale Price | Title Company |
|---|---|---|---|
| First Financial Group Lc | $26,378 | None Available | |
| Godfrey Christopher | $98,000 | None Available | |
| Caligiuri Lanny | -- | None Available | |
| Federal National Mortgage Association | $29,500 | None Available | |
| Mortgage Electronic Registration Systems | $29,408 | None Available |
Source: Public Records
Mortgage History
| Date | Status | Borrower | Loan Amount |
|---|---|---|---|
| Previous Owner | Godfrey Christopher | $78,000 |
Source: Public Records
Tax History Compared to Growth
Tax History
| Year | Tax Paid | Tax Assessment Tax Assessment Total Assessment is a certain percentage of the fair market value that is determined by local assessors to be the total taxable value of land and additions on the property. | Land | Improvement |
|---|---|---|---|---|
| 2025 | $1,344 | $86,890 | $11,200 | $75,690 |
| 2024 | $1,312 | $75,250 | $11,200 | $64,050 |
| 2023 | $1,184 | $75,250 | $11,200 | $64,050 |
| 2022 | $1,754 | $55,440 | $5,120 | $50,320 |
| 2021 | $1,754 | $81,780 | $5,120 | $76,660 |
| 2020 | $1,538 | $70,830 | $5,120 | $65,710 |
| 2019 | $1,590 | $70,830 | $5,120 | $65,710 |
| 2018 | $1,556 | $70,830 | $5,120 | $65,710 |
| 2017 | $394 | $70,830 | $5,120 | $65,710 |
| 2016 | $1,552 | $70,830 | $0 | $0 |
| 2015 | $1,552 | $61,230 | $0 | $0 |
| 2014 | $1,360 | $61,230 | $0 | $0 |
| 2013 | $1,336 | $0 | $0 | $0 |
| 2012 | -- | $59,040 | $4,830 | $54,210 |
Source: Public Records
Map
Nearby Homes
- 1215 Farnam St
- 409 E 14th St
- 637 E 15th St
- 407 E 14th St
- 914 Farnam St
- 320 E 14th St
- 511 Kirkwood Blvd
- 1134 Tremont Ave
- 1222 Pershing Ave
- 209 E 13th St
- 413 E 9th St
- 325 Kirkwood Blvd
- 420 Kirkwood Blvd
- 618 Douglas Ct
- 1605 Arlington Ave
- 916 Kirkwood Blvd
- 1020 E 15th St
- 715 Iowa St
- 230 Kirkwood Blvd
- 430 E 7th St
- 1129 Farnam St
- 1125 Farnam St
- 1201 Farnam St
- 1201 Farnam St Unit 2
- 1201 Farnam St Unit 1
- 621 E 12th St
- 1207 Farnam St
- 622 E 12th St
- 1128 Farnam St
- 629 E 12th St
- 626 E 12th St
- 1204 Farnam St
- 1126 Farnam St
- 630 E 12th St
- 1219 Farnam St
- 517 E 12th St
- 1208 Farnam St
- 635 E 12th St
- 518 E 12th St
- 634 E 12th St