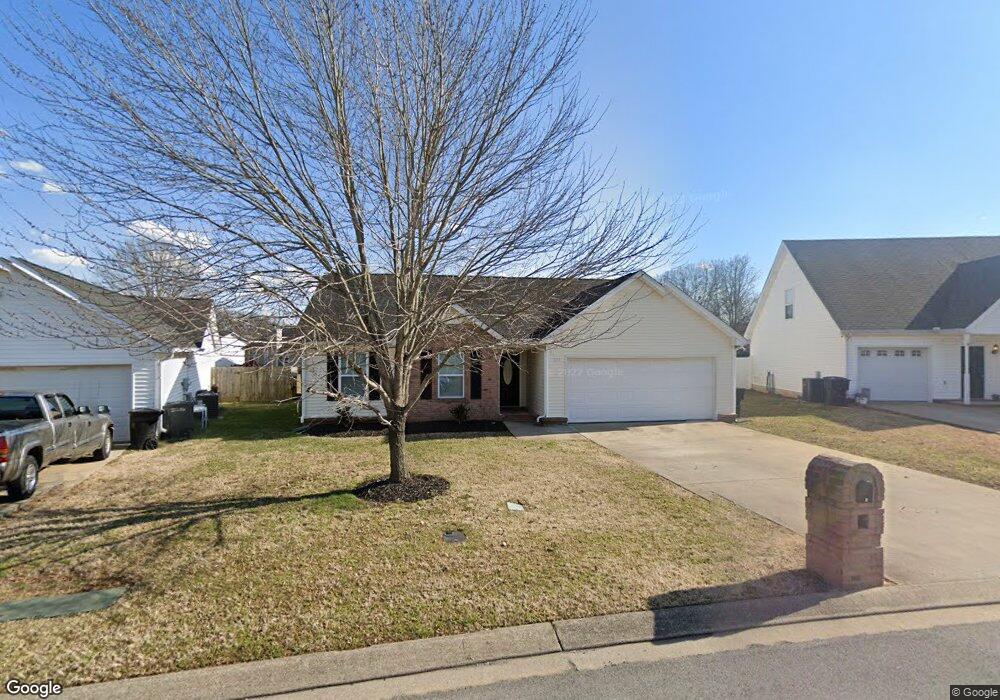
1131 Melvin Dr Murfreesboro, TN 37128
Estimated Value: $232,000 - $352,000
About This Home
Please note, our homes are available on a first-come, first-serve basis and are not reserved until the lease is signed by all applicants and security deposits are collected.
This home features Progress Smart Home - Progress Residential's smart home app, which allows you to control the home securely from any of your devices. Learn more at
Want to tour on your own? Click the “Self Tour” button on this home’s listing or call to register for a self-guided showing at a time that works best for you.
This charming three-bedroom, two-bathroom rental home in Murfreesboro, TN is move-in ready. It features a patio in the back and a two-car garage with a convenient entryway into the kitchen. The interior layout includes an airy living room boasting a vaulted ceiling with an overhead fan and a cozy gas fireplace, which is the highlight of the room. The adjacent dining room with a lovely chandelier offers a welcoming space to host dinner parties and memorable gatherings. The adjoining kitchen features granite countertops, stainless steel appliances, and ample cabinet storage. Unwind after a busy day in the main bedroom that boasts a walk-in closet and a private bathroom featuring a dual-sink vanity with storage. Schedule your showing of this rental home soon.
Ownership History
Purchase Details
Purchase Details
Purchase Details
Purchase Details
Purchase Details
Home Values in the Area
Average Home Value in this Area
Purchase History
| Date | Buyer | Sale Price | Title Company |
|---|---|---|---|
| Yamasa Co Ltd | $205,400 | None Listed On Document | |
| Property Owner 10 Llc | $205,400 | Os National Llc | |
| Opendoor Property C Llc | $205,300 | Os National Llc | |
| Marchese Linda R | -- | -- | |
| Marchese Linda R | $102,900 | -- |
Property History
| Date | Event | Price | List to Sale | Price per Sq Ft |
|---|---|---|---|---|
| 07/11/2025 07/11/25 | Off Market | $1,995 | -- | -- |
| 07/02/2025 07/02/25 | Price Changed | $1,995 | -4.8% | $1 / Sq Ft |
| 07/01/2025 07/01/25 | For Rent | $2,095 | 0.0% | -- |
| 05/20/2025 05/20/25 | Off Market | $2,095 | -- | -- |
| 05/07/2025 05/07/25 | Price Changed | $2,095 | +0.2% | $2 / Sq Ft |
| 05/05/2025 05/05/25 | Price Changed | $2,090 | +1.2% | $2 / Sq Ft |
| 04/30/2025 04/30/25 | Price Changed | $2,065 | -1.9% | $2 / Sq Ft |
| 04/26/2025 04/26/25 | Price Changed | $2,105 | -1.6% | $2 / Sq Ft |
| 04/22/2025 04/22/25 | Price Changed | $2,140 | -0.7% | $2 / Sq Ft |
| 04/20/2025 04/20/25 | Price Changed | $2,155 | -0.5% | $2 / Sq Ft |
| 04/18/2025 04/18/25 | Price Changed | $2,165 | +2.1% | $2 / Sq Ft |
| 04/17/2025 04/17/25 | Price Changed | $2,120 | +0.5% | $2 / Sq Ft |
| 04/16/2025 04/16/25 | Price Changed | $2,110 | -0.9% | $2 / Sq Ft |
| 04/12/2025 04/12/25 | Price Changed | $2,130 | +1.4% | $2 / Sq Ft |
| 04/09/2025 04/09/25 | Price Changed | $2,100 | -0.5% | $2 / Sq Ft |
| 04/08/2025 04/08/25 | Price Changed | $2,110 | -1.4% | $2 / Sq Ft |
| 04/04/2025 04/04/25 | Price Changed | $2,140 | +4.1% | $2 / Sq Ft |
| 04/02/2025 04/02/25 | Price Changed | $2,055 | -1.9% | $2 / Sq Ft |
| 04/01/2025 04/01/25 | Price Changed | $2,095 | -0.2% | $2 / Sq Ft |
| 02/26/2025 02/26/25 | Price Changed | $2,100 | -0.7% | $2 / Sq Ft |
| 02/23/2025 02/23/25 | Price Changed | $2,115 | +0.2% | $2 / Sq Ft |
| 02/21/2025 02/21/25 | Price Changed | $2,110 | -27.7% | $2 / Sq Ft |
| 02/06/2025 02/06/25 | For Rent | $2,920 | -- | -- |
Tax History Compared to Growth
Tax History
| Year | Tax Paid | Tax Assessment Tax Assessment Total Assessment is a certain percentage of the fair market value that is determined by local assessors to be the total taxable value of land and additions on the property. | Land | Improvement |
|---|---|---|---|---|
| 2025 | $1,909 | $67,475 | $13,750 | $53,725 |
| 2024 | $1,909 | $67,475 | $13,750 | $53,725 |
| 2023 | $1,266 | $67,475 | $13,750 | $53,725 |
| 2022 | $1,091 | $67,475 | $13,750 | $53,725 |
| 2021 | $1,098 | $49,488 | $9,375 | $40,113 |
| 2020 | $1,098 | $49,488 | $9,375 | $40,113 |
| 2019 | $1,098 | $49,488 | $9,375 | $40,113 |
| 2018 | $1,509 | $49,488 | $0 | $0 |
| 2017 | $1,357 | $34,925 | $0 | $0 |
| 2016 | $1,357 | $34,925 | $0 | $0 |
| 2015 | $1,357 | $34,925 | $0 | $0 |
| 2014 | $868 | $34,925 | $0 | $0 |
| 2013 | -- | $35,550 | $0 | $0 |
Map
- 1518 Saint Andrews Dr
- 627 Tidesridge Ct
- 725 Stonetrace Dr
- 2940 Waywood Dr
- 647 Stonetrace Dr
- 2905 Stonehedge Dr
- 1421 Rebecca Johns Dr
- 1442 Rebecca Johns Dr Unit V20
- 1710 Locerbie Dr
- 3331 Alta Ln
- 3315 Alta Ln
- 1541 Teresa Ln
- 2307 Katie Ct
- 412 Conhocken Ct
- 1419 Cason Trail
- 1725 Satterfield Ct
- 1417 Ovaldale Dr
- 1823 Joben Dr
- 2326 Amber Glen Dr
- 2319 Amber Glen Dr
- 1127 Melvin Dr
- 1135 Melvin Dr
- 2830 Castlerea Dr
- 1123 Melvin Dr
- 1126 Melvin Dr
- 2822 Castlerea Dr
- 1130 Melvin Dr
- 1119 Melvin Dr
- 2839 Castlerea Dr
- 1134 Melvin Dr
- 2818 Castlerea Dr
- 2835 Castlerea Dr
- 2831 Castlerea Dr
- 2823 Castlerea Dr
- 2827 Castlerea Dr
- 1115 Melvin Dr
- 2819 Castlerea Dr
- 1118 Melvin Dr
- 1138 Melvin Dr
- 1143 Melvin Dr