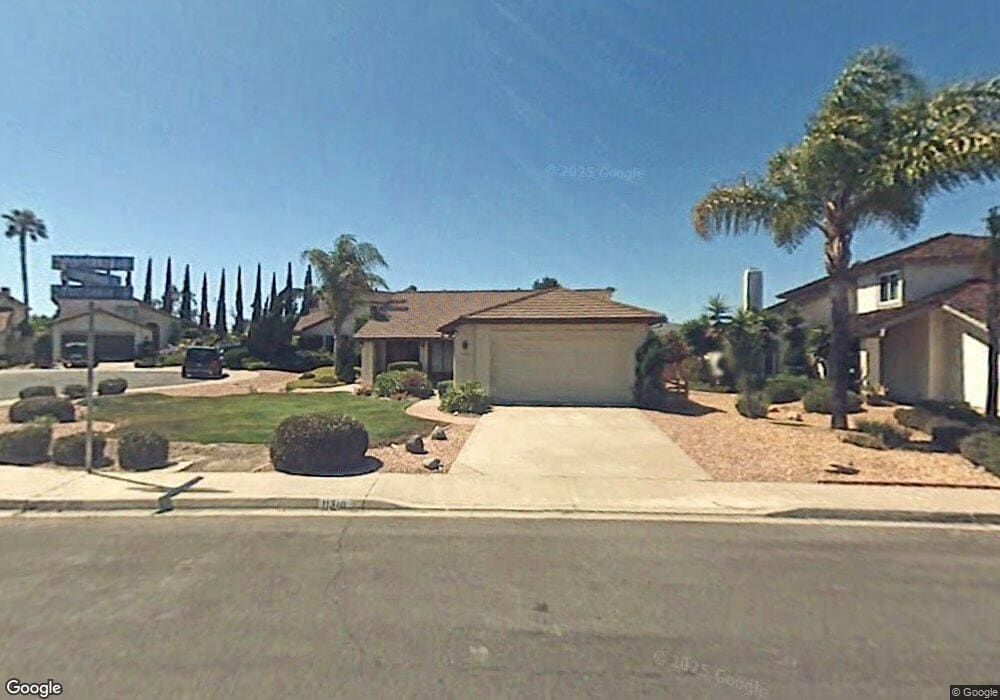
11310 Turtleback Ln San Diego, CA 92127
Rancho Bernardo NeighborhoodEstimated Value: $1,159,496 - $1,407,000
3
Beds
2
Baths
1,528
Sq Ft
$821/Sq Ft
Est. Value
About This Home
This home is located at 11310 Turtleback Ln, San Diego, CA 92127 and is currently estimated at $1,254,624, approximately $821 per square foot. 11310 Turtleback Ln is a home located in San Diego County with nearby schools including Turtleback Elementary, Bernardo Heights Middle, and Rancho Bernardo High.
Ownership History
Date
Name
Owned For
Owner Type
Purchase Details
Closed on
Apr 20, 2015
Sold by
Vong Binh Gia and Kim Sun Hee
Bought by
Napkie Brian and Kashef Sahar
Current Estimated Value
Home Financials for this Owner
Home Financials are based on the most recent Mortgage that was taken out on this home.
Original Mortgage
$465,600
Outstanding Balance
$357,513
Interest Rate
3.67%
Mortgage Type
New Conventional
Estimated Equity
$897,111
Purchase Details
Closed on
Apr 9, 2014
Sold by
Ditchman Karen L and Mcgovern Janice M
Bought by
Vong Binh Gia and Kim Sun Hee
Home Financials for this Owner
Home Financials are based on the most recent Mortgage that was taken out on this home.
Original Mortgage
$424,000
Interest Rate
4.32%
Mortgage Type
New Conventional
Purchase Details
Closed on
Jan 22, 2013
Sold by
Witek Frances
Bought by
Witek Robert A and Ditchman Karen L
Purchase Details
Closed on
Jan 18, 1996
Sold by
Witek Henry R and Witek Frances
Bought by
Witek Henry R and Witek Frances
Create a Home Valuation Report for This Property
The Home Valuation Report is an in-depth analysis detailing your home's value as well as a comparison with similar homes in the area
Home Values in the Area
Average Home Value in this Area
Purchase History
| Date | Buyer | Sale Price | Title Company |
|---|---|---|---|
| Napkie Brian | $582,000 | Fidelity National Title | |
| Vong Binh Gia | $530,000 | First American Title Company | |
| Witek Robert A | -- | None Available | |
| Witek Frances | -- | None Available | |
| Witek Henry R | -- | -- |
Source: Public Records
Mortgage History
| Date | Status | Borrower | Loan Amount |
|---|---|---|---|
| Open | Napkie Brian | $465,600 | |
| Previous Owner | Vong Binh Gia | $424,000 |
Source: Public Records
Tax History Compared to Growth
Tax History
| Year | Tax Paid | Tax Assessment Tax Assessment Total Assessment is a certain percentage of the fair market value that is determined by local assessors to be the total taxable value of land and additions on the property. | Land | Improvement |
|---|---|---|---|---|
| 2025 | $8,010 | $727,911 | $290,301 | $437,610 |
| 2024 | $8,010 | $713,639 | $284,609 | $429,030 |
| 2023 | $7,839 | $699,647 | $279,029 | $420,618 |
| 2022 | $7,707 | $685,929 | $273,558 | $412,371 |
| 2021 | $7,606 | $672,481 | $268,195 | $404,286 |
| 2020 | $7,502 | $665,586 | $265,445 | $400,141 |
| 2019 | $7,306 | $652,537 | $260,241 | $392,296 |
| 2018 | $7,066 | $629,743 | $255,139 | $374,604 |
| 2017 | $83 | $602,690 | $250,137 | $352,553 |
| 2016 | $6,578 | $590,874 | $245,233 | $345,641 |
| 2015 | $5,946 | $540,588 | $224,363 | $316,225 |
| 2014 | -- | $192,518 | $79,902 | $112,616 |
Source: Public Records
Map
Nearby Homes
- 15353 Maturin Dr Unit 115
- 15273 Maturin Dr Unit 40
- 11781 Caminito de Las Missiones
- 15283 Maturin Dr Unit 62
- 15373 Maturin Dr Unit 178
- 16003 Caminito de Linda
- 16232 Avenida Venusto Unit B
- 16244 Avenida Venusto Unit A
- 11313 Avenida de Los Lobos Unit B
- 11705 Via Medanos
- 11263 Avenida de Los Lobos Unit D
- 16430 Avenida Venusto Unit D
- 16205 Via Embeleso
- 12141 Iron View Row
- 15985 Camino Crisalida Unit 5
- 15610 Corte Raposo
- 16731 Acena Dr
- 12047 Avenida Consentido
- 12105 View Pointe Row
- 12085 Calle de Maria
- 11318 Turtleback Ln
- 11280 Turtleback Ct
- 11326 Turtleback Ln
- 11270 Turtleback Ct
- 11325 Turtleback Ln
- 11272 Turtleback Ct
- 11334 Turtleback Ln
- 11292 Turtleback Ct Unit 1
- 11282 Turtleback Ct
- 16225 Turtleback Rd
- 11333 Turtleback Ln
- 11342 Turtleback Ln
- 16222 Turtleback Rd
- 11341 Turtleback Ln
- 11350 Turtleback Ln
- 16225 Rimstone Ln
- 16234 Rimstone Ln
- 11310 Cloudcrest Dr
- 11349 Turtleback Ln
- 16212 Turtleback Rd