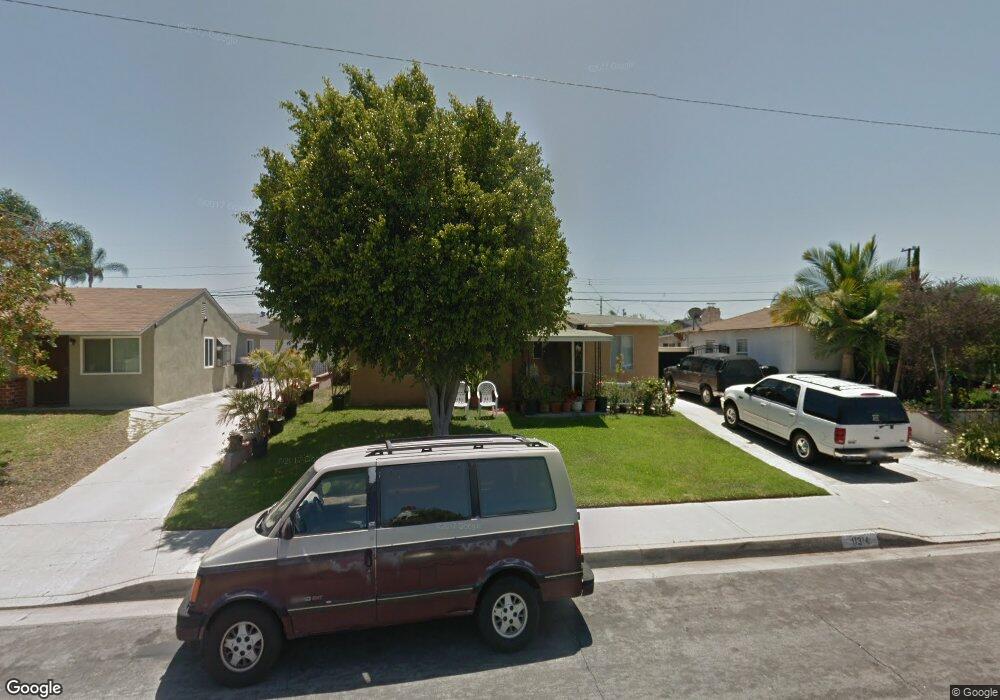
11314 Leland Ave Whittier, CA 90605
South Whittier NeighborhoodEstimated Value: $684,000 - $763,000
3
Beds
1
Bath
1,013
Sq Ft
$709/Sq Ft
Est. Value
About This Home
This home is located at 11314 Leland Ave, Whittier, CA 90605 and is currently estimated at $718,183, approximately $708 per square foot. 11314 Leland Ave is a home located in Los Angeles County with nearby schools including California High School and St. Gregory The Great.
Ownership History
Date
Name
Owned For
Owner Type
Purchase Details
Closed on
May 10, 2016
Sold by
Hernandez Mario
Bought by
Magana Martha Lorena
Current Estimated Value
Home Financials for this Owner
Home Financials are based on the most recent Mortgage that was taken out on this home.
Original Mortgage
$186,558
Outstanding Balance
$148,947
Interest Rate
3.75%
Mortgage Type
FHA
Estimated Equity
$569,236
Purchase Details
Closed on
Sep 23, 2004
Sold by
Hernandez Mario and Hernandez Maria
Bought by
Hernandez Mario
Home Financials for this Owner
Home Financials are based on the most recent Mortgage that was taken out on this home.
Original Mortgage
$149,328
Interest Rate
5.76%
Mortgage Type
New Conventional
Purchase Details
Closed on
Jun 30, 1995
Sold by
Cranfill James F and Cranfill Clover Fern
Bought by
Hernandez Mario
Home Financials for this Owner
Home Financials are based on the most recent Mortgage that was taken out on this home.
Original Mortgage
$134,765
Interest Rate
7.61%
Mortgage Type
FHA
Create a Home Valuation Report for This Property
The Home Valuation Report is an in-depth analysis detailing your home's value as well as a comparison with similar homes in the area
Home Values in the Area
Average Home Value in this Area
Purchase History
| Date | Buyer | Sale Price | Title Company |
|---|---|---|---|
| Magana Martha Lorena | $190,000 | Title 365 | |
| Magana Martha Lorena | -- | Title 365 | |
| Hernandez Mario | -- | Orange Coast Title Company | |
| Hernandez Mario | $136,500 | Continental Lawyers Title Co |
Source: Public Records
Mortgage History
| Date | Status | Borrower | Loan Amount |
|---|---|---|---|
| Open | Magana Martha Lorena | $186,558 | |
| Previous Owner | Hernandez Mario | $149,328 | |
| Previous Owner | Hernandez Mario | $134,765 |
Source: Public Records
Tax History Compared to Growth
Tax History
| Year | Tax Paid | Tax Assessment Tax Assessment Total Assessment is a certain percentage of the fair market value that is determined by local assessors to be the total taxable value of land and additions on the property. | Land | Improvement |
|---|---|---|---|---|
| 2025 | $3,978 | $312,290 | $203,516 | $108,774 |
| 2024 | $3,978 | $306,168 | $199,526 | $106,642 |
| 2023 | $3,856 | $300,165 | $195,614 | $104,551 |
| 2022 | $3,878 | $294,280 | $191,779 | $102,501 |
| 2021 | $3,797 | $288,511 | $188,019 | $100,492 |
| 2019 | $3,729 | $279,956 | $182,444 | $97,512 |
| 2018 | $3,574 | $274,467 | $178,867 | $95,600 |
| 2016 | $3,477 | $263,811 | $171,922 | $91,889 |
| 2015 | $3,390 | $259,849 | $169,340 | $90,509 |
| 2014 | $3,360 | $254,760 | $166,023 | $88,737 |
Source: Public Records
Map
Nearby Homes
- 11426 Newgate Ave
- 11329 Telechron Ave
- 13538 Lukay St
- 11116 Leland Ave
- 13481 Meyer Rd
- 13305 Meyer Rd Unit B
- 10849 Inez St
- 11828 Louis Ave
- 11531 Sunnybrook Ln
- 13272 Beaty Ave
- 11118 Bunker Ln
- 11102 Eagle Ln
- 13857 Leffingwell Rd
- 11518 Fidel Ave
- 10745 Victoria Ave Unit 4
- 10745 Victoria Ave Unit 6
- 10745 Victoria Ave
- 13513 Leffingwell Rd
- 11827 Loma Dr Unit 15
- 11624 Starlight Ave
- 11310 Leland Ave
- 11320 Leland Ave
- 11319 Alclad Ave
- 11304 Leland Ave
- 11326 Leland Ave
- 11313 Alclad Ave
- 11325 Alclad Ave
- 11309 Alclad Ave
- 11331 Alclad Ave
- 11232 Leland Ave
- 11400 Leland Ave
- 11315 Leland Ave
- 11321 Leland Ave
- 11303 Alclad Ave
- 11403 Alclad Ave
- 11309 Leland Ave
- 11327 Leland Ave
- 11406 Leland Ave
- 11303 Leland Ave
- 11229 Alclad Ave