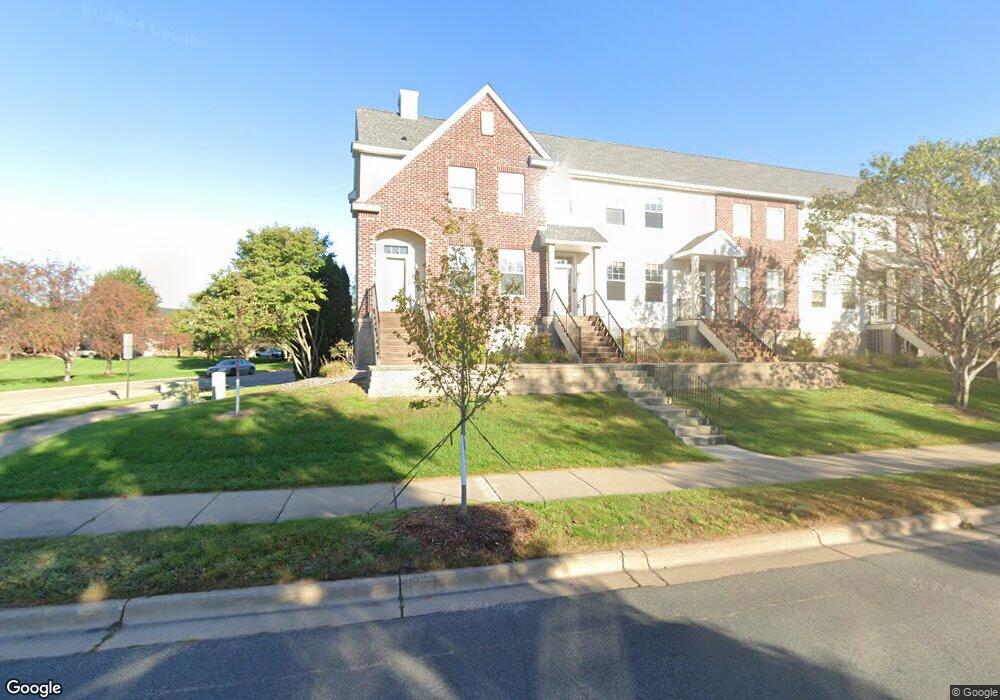
11316 Fergus St NE Unit B Minneapolis, MN 55449
Estimated Value: $243,030 - $265,000
2
Beds
2
Baths
1,200
Sq Ft
$211/Sq Ft
Est. Value
About This Home
This home is located at 11316 Fergus St NE Unit B, Minneapolis, MN 55449 and is currently estimated at $253,008, approximately $210 per square foot. 11316 Fergus St NE Unit B is a home located in Anoka County with nearby schools including Sunrise Elementary School, Northdale Middle School, and Blaine Senior High School.
Ownership History
Date
Name
Owned For
Owner Type
Purchase Details
Closed on
Apr 16, 2021
Sold by
Lund Dayna M
Bought by
Chang Kehua and Zhu Hong
Current Estimated Value
Home Financials for this Owner
Home Financials are based on the most recent Mortgage that was taken out on this home.
Original Mortgage
$153,750
Outstanding Balance
$115,523
Interest Rate
3.05%
Mortgage Type
New Conventional
Estimated Equity
$137,485
Purchase Details
Closed on
Dec 28, 2015
Sold by
Christofferson Lucas Lucas
Bought by
Lund Dayna Dayna
Home Financials for this Owner
Home Financials are based on the most recent Mortgage that was taken out on this home.
Original Mortgage
$142,861
Interest Rate
3.96%
Purchase Details
Closed on
Apr 29, 2003
Sold by
The Rottlund Company Inc
Bought by
Field Stephanie R and Field Steven G
Purchase Details
Closed on
Mar 25, 2003
Sold by
Tradition Development
Bought by
The Rottlund Co
Create a Home Valuation Report for This Property
The Home Valuation Report is an in-depth analysis detailing your home's value as well as a comparison with similar homes in the area
Home Values in the Area
Average Home Value in this Area
Purchase History
| Date | Buyer | Sale Price | Title Company |
|---|---|---|---|
| Chang Kehua | $204,909 | Trademark Title Services Inc | |
| Lund Dayna Dayna | $144,900 | -- | |
| Field Stephanie R | $160,940 | -- | |
| The Rottlund Co | $870,834 | -- |
Source: Public Records
Mortgage History
| Date | Status | Borrower | Loan Amount |
|---|---|---|---|
| Open | Chang Kehua | $153,750 | |
| Previous Owner | Lund Dayna Dayna | $142,861 |
Source: Public Records
Tax History Compared to Growth
Tax History
| Year | Tax Paid | Tax Assessment Tax Assessment Total Assessment is a certain percentage of the fair market value that is determined by local assessors to be the total taxable value of land and additions on the property. | Land | Improvement |
|---|---|---|---|---|
| 2025 | $2,468 | $235,500 | $58,300 | $177,200 |
| 2024 | $2,468 | $228,900 | $50,700 | $178,200 |
| 2023 | $2,168 | $224,400 | $44,400 | $180,000 |
| 2022 | $1,700 | $225,600 | $40,000 | $185,600 |
| 2021 | $1,696 | $172,400 | $26,000 | $146,400 |
| 2020 | $1,693 | $168,500 | $30,000 | $138,500 |
| 2019 | $1,495 | $162,800 | $25,000 | $137,800 |
| 2018 | $1,507 | $143,800 | $0 | $0 |
| 2017 | $1,300 | $141,800 | $0 | $0 |
| 2016 | $1,299 | $123,500 | $0 | $0 |
| 2015 | -- | $123,500 | $23,800 | $99,700 |
| 2014 | -- | $110,300 | $26,400 | $83,900 |
Source: Public Records
Map
Nearby Homes
- 11358 Chisholm Cir NE Unit E
- 11221 Aberdeen St NE Unit I
- 11125 Baltimore St NE Unit L
- 1824 111th Ave NE
- 1842 111th Ave NE
- 10911 Goodhue St NE Unit D
- 1635 117th Ave NE
- 11365 Pierce St NE
- 11429 Pierce St NE
- 11505 Palisade Ct NE
- 11213 Fillmore St NE
- 1060 109th Ct NE
- 10717 Lincoln St NE
- 961 113th Ave NE
- 11038 Polk St NE
- 10753 Tyler Ct NE
- 11741 Fillmore St NE
- 11030 Amen Cir NE
- 11995 Aberdeen St NE Unit 11995
- 10809 Tyler Ct NE
- 11316 Fergus St NE Unit F
- 11316 Fergus St NE Unit D
- 11316 Fergus St NE Unit C
- 11316 Fergus St NE Unit A
- 11316 11316 Fergus-Street-ne
- 11316 11316 Fergus St NE
- 11327 Fergus St NE Unit F
- 11327 Fergus St NE Unit E
- 11327 Fergus St NE Unit D
- 11327 Fergus St NE Unit C
- 11327 Fergus St NE Unit A
- 11305 Fergus St NE Unit F
- 11305 Fergus St NE Unit C
- 11305 Fergus St NE Unit B
- 11305 Fergus St NE Unit A
- 11305 Fergus St NE
- 11305 Fergus St NE Unit D
- 11305 Fergus St NE Unit 1702
- 11305 11305 Fergus-Street-ne
- 11305 11305 Fergus St NE