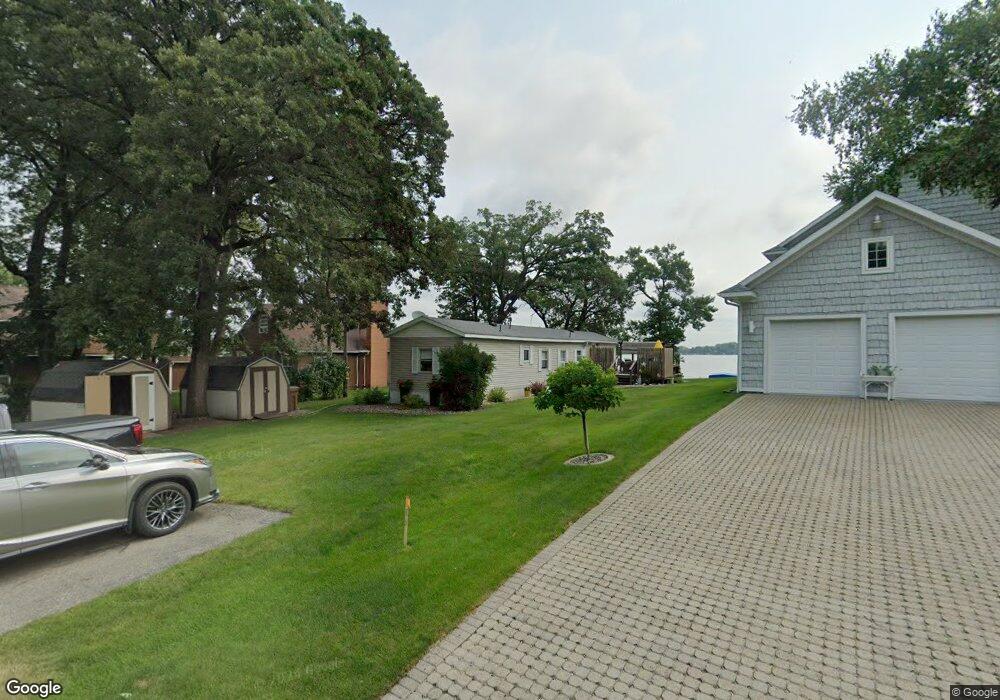
11317 W Lake Eunice Rd Detroit Lakes, MN 56501
Estimated Value: $265,000 - $401,000
3
Beds
1
Bath
850
Sq Ft
$413/Sq Ft
Est. Value
About This Home
This home is located at 11317 W Lake Eunice Rd, Detroit Lakes, MN 56501 and is currently estimated at $351,415, approximately $413 per square foot. 11317 W Lake Eunice Rd is a home located in Becker County with nearby schools including Lake Park Audubon Elementary School and Lake Park Audubon High School.
Ownership History
Date
Name
Owned For
Owner Type
Purchase Details
Closed on
Sep 9, 2021
Sold by
English David and English Margie
Bought by
English David and English Margie
Current Estimated Value
Purchase Details
Closed on
Sep 8, 2021
Sold by
English David and English Margie
Bought by
Runck Lindsey L and English John D
Purchase Details
Closed on
Sep 16, 2020
Sold by
Nelson Randy O and Nelson Mary K
Bought by
English David and English Margie
Purchase Details
Closed on
Aug 5, 2014
Sold by
Petersen Suzanne and Grant Robyn
Bought by
Nelson Randy O and Nelson Mary K
Purchase Details
Closed on
Sep 29, 2010
Sold by
Beauchene Mark and Beauchene Sheila M
Bought by
Petersen Suzanne and Grant Robyn
Purchase Details
Closed on
Jul 28, 2006
Sold by
Larson Kevin H and Larson Cheryl M
Bought by
Beauchene Mark and Beauchene Sheila M
Create a Home Valuation Report for This Property
The Home Valuation Report is an in-depth analysis detailing your home's value as well as a comparison with similar homes in the area
Home Values in the Area
Average Home Value in this Area
Purchase History
| Date | Buyer | Sale Price | Title Company |
|---|---|---|---|
| English David | -- | None Listed On Document | |
| Runck Lindsey L | -- | None Available | |
| English David | $268,500 | None Available | |
| Nelson Randy O | $167,000 | Bcts | |
| Petersen Suzanne | $184,700 | The Title Company | |
| Beauchene Mark | $200,000 | The Title Company Fargo |
Source: Public Records
Tax History Compared to Growth
Tax History
| Year | Tax Paid | Tax Assessment Tax Assessment Total Assessment is a certain percentage of the fair market value that is determined by local assessors to be the total taxable value of land and additions on the property. | Land | Improvement |
|---|---|---|---|---|
| 2025 | $1,658 | $304,400 | $253,900 | $50,500 |
| 2024 | $1,622 | $280,700 | $253,900 | $26,800 |
| 2023 | $1,688 | $254,900 | $231,800 | $23,100 |
| 2022 | $1,708 | $222,700 | $209,600 | $13,100 |
| 2021 | $1,582 | $212,900 | $200,200 | $12,700 |
| 2020 | $1,612 | $212,900 | $200,200 | $12,700 |
| 2019 | $1,634 | $212,400 | $200,200 | $12,200 |
| 2018 | $1,394 | $207,100 | $200,200 | $6,900 |
| 2017 | $1,260 | $171,100 | $164,000 | $7,100 |
| 2016 | $1,306 | $150,300 | $144,300 | $6,000 |
| 2015 | $1,332 | $157,200 | $144,300 | $12,900 |
| 2014 | -- | $172,600 | $159,700 | $12,900 |
Source: Public Records
Map
Nearby Homes
- 21335 Halstad Lake Rd
- 51418 County Highway 31
- 11450 Cormorant Heights Rd
- 11150 Cormorant Heights Rd
- 50943 Fish Lake Rd
- 51021 #8 Fish Lake Rd
- 23078 Gosslee Ln
- TBD Ottoson Rd
- TBD County Highway 15
- 23093 Roosevelt Beach Ln
- 23271 Roosevelt Beach Ln
- 13847 Pearl Lake Ln
- 17123 Lakeview Ln
- 11003 Eagles Nest Ct
- TBD Knollwood Ln
- 49330 Fish Lake Rd
- 22623 Knollwood Ln
- Tract C Blybergs Ln
- Tract H Blybergs Ln
- Tract K Blybergs Ln
- 11307 W Lake Eunice Rd
- 11327 W Lake Eunice Rd
- 11337 W Lake Eunice Rd
- 11349 W Lake Eunice Rd
- 11301 W Lake Eunice Rd
- 11298 W Lake Eunice Rd
- 11273 W Lake Eunice Rd
- 11367 W Lake Eunice Rd
- 11261 W Lake Eunice Rd
- 11385 W Lake Eunice Rd
- 11253 W Lake Eunice Rd
- 11256 W Lake Eunice Rd
- 32903 Pine St
- 11243 W Lake Eunice Rd
- 11393 W Lake Eunice Rd
- 11399 W Lake Eunice Rd
- 11223 W Lake Eunice Rd
- 11417 W Lake Eunice Rd
- 11431 W Lake Eunice Rd
- 11443 W Lake Eunice Rd