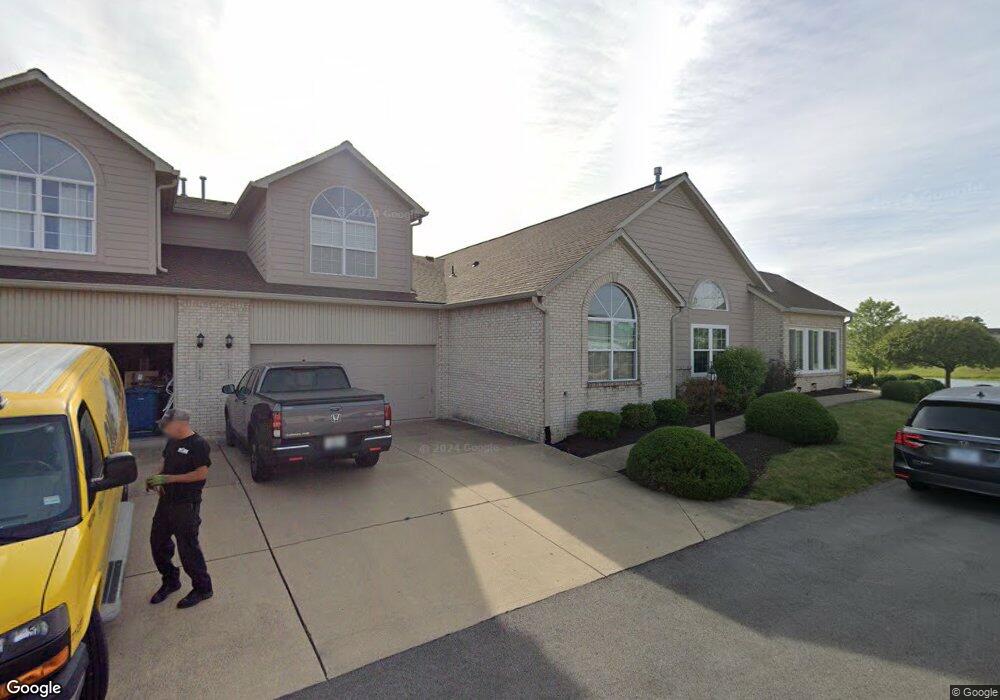
11317 Winding Wood Ct Unit 12/47 Indianapolis, IN 46235
Estimated Value: $257,000 - $270,000
2
Beds
3
Baths
2,051
Sq Ft
$129/Sq Ft
Est. Value
About This Home
This home is located at 11317 Winding Wood Ct Unit 12/47, Indianapolis, IN 46235 and is currently estimated at $264,813, approximately $129 per square foot. 11317 Winding Wood Ct Unit 12/47 is a home located in Marion County with nearby schools including Winding Ridge Elementary School, Belzer Middle School, and Lawrence Central High School.
Ownership History
Date
Name
Owned For
Owner Type
Purchase Details
Closed on
Sep 22, 2023
Sold by
Meriwither Lee R and Meriwither Carol Jean
Bought by
Inskeep Larry D and Inskeep Brenda J
Current Estimated Value
Purchase Details
Closed on
Sep 21, 2023
Sold by
Meriwither Lee R and Meriwither Carol Jean
Bought by
Inskeep Larry D and Inskeep Brenda J
Purchase Details
Closed on
Jul 28, 2005
Sold by
Cendant Mobility Financial Corp
Bought by
Meriwither Lee R and Meriwither Carol Jean
Home Financials for this Owner
Home Financials are based on the most recent Mortgage that was taken out on this home.
Original Mortgage
$171,600
Interest Rate
5.93%
Mortgage Type
New Conventional
Purchase Details
Closed on
Apr 5, 2005
Sold by
Overly Joanne
Bought by
Cendant Mobility Financial Corporation
Create a Home Valuation Report for This Property
The Home Valuation Report is an in-depth analysis detailing your home's value as well as a comparison with similar homes in the area
Home Values in the Area
Average Home Value in this Area
Purchase History
| Date | Buyer | Sale Price | Title Company |
|---|---|---|---|
| Inskeep Larry D | -- | Eagle Land Title | |
| Inskeep Larry D | $249,900 | Eagle Land Title | |
| Meriwither Lee R | -- | Chicago Title Ins Co | |
| Cendant Mobility Financial Corporation | -- | None Available |
Source: Public Records
Mortgage History
| Date | Status | Borrower | Loan Amount |
|---|---|---|---|
| Previous Owner | Meriwither Lee R | $171,600 |
Source: Public Records
Tax History Compared to Growth
Tax History
| Year | Tax Paid | Tax Assessment Tax Assessment Total Assessment is a certain percentage of the fair market value that is determined by local assessors to be the total taxable value of land and additions on the property. | Land | Improvement |
|---|---|---|---|---|
| 2024 | $2,884 | $264,200 | $27,200 | $237,000 |
| 2023 | $2,884 | $258,900 | $27,200 | $231,700 |
| 2022 | $2,717 | $237,500 | $27,000 | $210,500 |
| 2021 | $2,447 | $213,900 | $27,000 | $186,900 |
| 2020 | $2,383 | $206,500 | $26,900 | $179,600 |
| 2019 | $2,069 | $200,400 | $27,100 | $173,300 |
| 2018 | $2,025 | $196,300 | $27,100 | $169,200 |
| 2017 | $1,744 | $168,400 | $26,700 | $141,700 |
| 2016 | $1,649 | $159,100 | $26,800 | $132,300 |
| 2014 | $1,400 | $140,000 | $26,600 | $113,400 |
| 2013 | $2,096 | $209,600 | $27,600 | $182,000 |
Source: Public Records
Map
Nearby Homes
- 11532 Glenn Abbey Ln
- 5339 Brassie Dr
- 11557 Glenn Abbey Ln
- 11620 Glenn Abbey Ln
- 5488 N German Church Rd
- 5440 N German Church Rd
- 11754 Hamble Dr
- 10919 E 56th St
- 11753 Pawleys Ct
- 11226 Winterwood Dr
- 11426 High Grass Dr
- 5262 Bogey Dr
- 5151 Sandwood Dr
- 11427 Flatstick Ct
- 5331 Hammock Glen Dr
- 10160 Pendleton Pike
- 11135 Pendleton Pike
- 5633 Wynridge Ct
- 5020 Greenside Dr
- 4846 Chip Shot Ln
- 11317 Winding Wood Ct
- 11323 Winding Wood Ct
- 11323 Winding Wood Ct Unit 12
- 11323 Winding Wood Ct Unit 12/46
- 11315 Winding Wood Ct
- 11315 Winding Wood Ct Unit 12/48
- 11321 Winding Wood Ct
- 11321 Winding Wood Ct Unit 12/45
- 11303 Winding Wood Ct
- 11303 Winding Wood Ct Unit 13
- 11301 Winding Wood Ct
- 11301 Winding Wood Ct Unit 49
- 11301 Winding Wood Ct Unit 13/49
- 11337 Winding Wood Ct
- 11337 Winding Wood Ct Unit 11
- 11337 Winding Wood Ct Unit 11/43
- 11253 Winding Wood Ct
- 11253 Winding Wood Ct Unit 13/51
- 11251 Winding Wood Ct
- 11251 Winding Wood Ct Unit 13/52