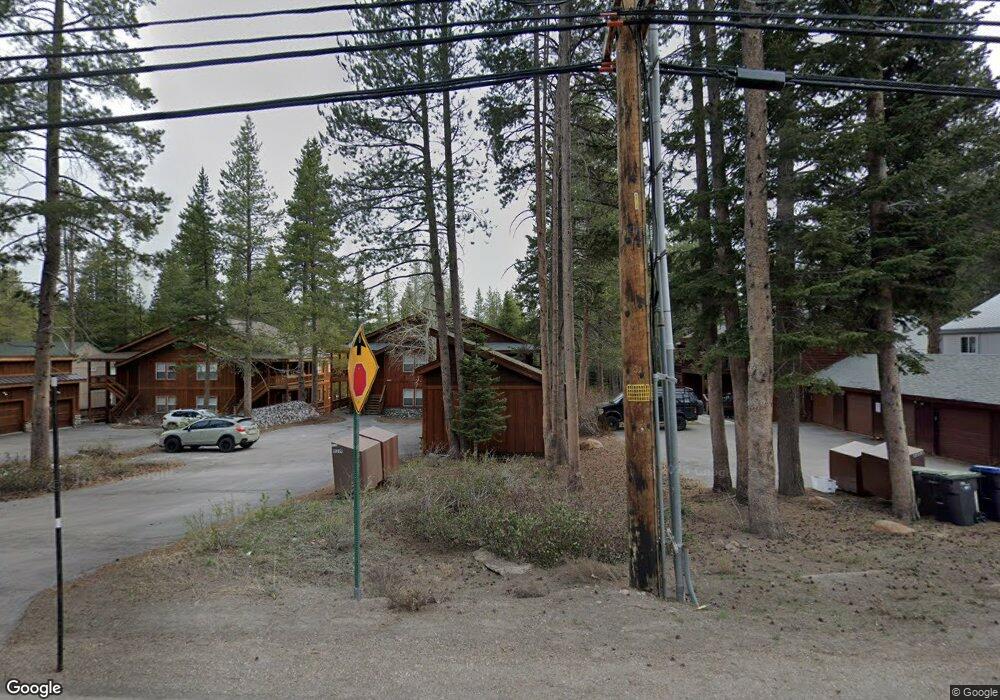
11319 Northwoods Blvd Unit 1 Truckee, CA 96161
Tahoe Donner NeighborhoodEstimated Value: $560,000 - $838,000
2
Beds
2
Baths
1,095
Sq Ft
$592/Sq Ft
Est. Value
About This Home
This home is located at 11319 Northwoods Blvd Unit 1, Truckee, CA 96161 and is currently estimated at $647,952, approximately $591 per square foot. 11319 Northwoods Blvd Unit 1 is a home located in Nevada County with nearby schools including Truckee Elementary School, Alder Creek Middle School, and Tahoe Truckee High School.
Ownership History
Date
Name
Owned For
Owner Type
Purchase Details
Closed on
Aug 25, 2004
Sold by
Dahlberg Dave M and Dahlberg Lesli N
Bought by
Batsford Michael and Batsford Leslie
Current Estimated Value
Home Financials for this Owner
Home Financials are based on the most recent Mortgage that was taken out on this home.
Original Mortgage
$287,920
Outstanding Balance
$134,200
Interest Rate
5%
Mortgage Type
Purchase Money Mortgage
Estimated Equity
$513,752
Purchase Details
Closed on
Sep 19, 2000
Sold by
Northwoods Zurich Development Llc
Bought by
Dahlberg David M and Dahlberg Lesli N
Home Financials for this Owner
Home Financials are based on the most recent Mortgage that was taken out on this home.
Original Mortgage
$240,000
Interest Rate
7.75%
Mortgage Type
Purchase Money Mortgage
Create a Home Valuation Report for This Property
The Home Valuation Report is an in-depth analysis detailing your home's value as well as a comparison with similar homes in the area
Home Values in the Area
Average Home Value in this Area
Purchase History
| Date | Buyer | Sale Price | Title Company |
|---|---|---|---|
| Batsford Michael | $360,000 | First American Title | |
| Dahlberg David M | $240,000 | Placer Title Company |
Source: Public Records
Mortgage History
| Date | Status | Borrower | Loan Amount |
|---|---|---|---|
| Open | Batsford Michael | $287,920 | |
| Previous Owner | Dahlberg David M | $240,000 |
Source: Public Records
Tax History Compared to Growth
Tax History
| Year | Tax Paid | Tax Assessment Tax Assessment Total Assessment is a certain percentage of the fair market value that is determined by local assessors to be the total taxable value of land and additions on the property. | Land | Improvement |
|---|---|---|---|---|
| 2025 | $6,944 | $504,657 | $128,448 | $376,209 |
| 2024 | $6,849 | $494,763 | $125,930 | $368,833 |
| 2023 | $6,849 | $485,062 | $123,461 | $361,601 |
| 2022 | $6,635 | $475,552 | $121,041 | $354,511 |
| 2021 | $6,290 | $466,169 | $118,609 | $347,560 |
| 2020 | $5,731 | $414,000 | $103,000 | $311,000 |
| 2019 | $5,715 | $405,900 | $101,000 | $304,900 |
| 2018 | $0 | $394,100 | $98,100 | $296,000 |
| 2017 | $4,793 | $364,800 | $90,800 | $274,000 |
| 2016 | $4,638 | $347,500 | $86,500 | $261,000 |
| 2015 | $4,519 | $340,800 | $84,800 | $256,000 |
| 2014 | -- | $312,800 | $77,800 | $235,000 |
Source: Public Records
Map
Nearby Homes
- 11249 Northwoods Blvd Unit 4
- 12698 Hidden Cir Unit 3
- 12678 Hidden Cir Unit 4
- 12685 Zurich Place
- 12686 Zurich Place Unit 2
- 12755 Zurich Place
- 12710 Zurich Place
- 17308 Northwoods Blvd
- 11422 Bennett Flat Rd
- 12815 Zurich Place
- 17263 Northwoods Blvd
- 12007 Bernese Ln
- 12800 Zurich Place
- 12834 Zurich Place Unit 2
- 11654 Lausanne Way
- 10734 Passage Place
- 10529 Mougle Ln
- 11940 Sitzmark Way
- 13081 Davos Dr
- 10894 Mougle Ln
- 11305 Northwoods Blvd Unit 1B
- 11305 Northwoods Blvd Unit D
- 11305 Northwoods Blvd Unit 3A
- 11305 Northwoods Blvd Unit 2
- 11305 Northwoods Blvd Unit B
- 11333 Northwoods Blvd
- 11333 Northwoods Blvd Unit 4
- 11333 Northwoods Blvd Unit 1
- 11291 Northwoods Blvd
- 11291 Northwoods Blvd Unit 3
- 11291 Northwoods Blvd Unit 1
- 11291 Northwoods Blvd Unit 2
- 11355 Northwoods Blvd
- 11285 Northwoods Blvd Unit 1
- 11285 Northwoods Blvd
- 11283 Northwoods Blvd
- 11371 Northwoods Blvd
- 11351 Northwoods Blvd Unit U
- 11351 Northwoods Blvd Unit U
- 11277 Northwoods Blvd Unit 2