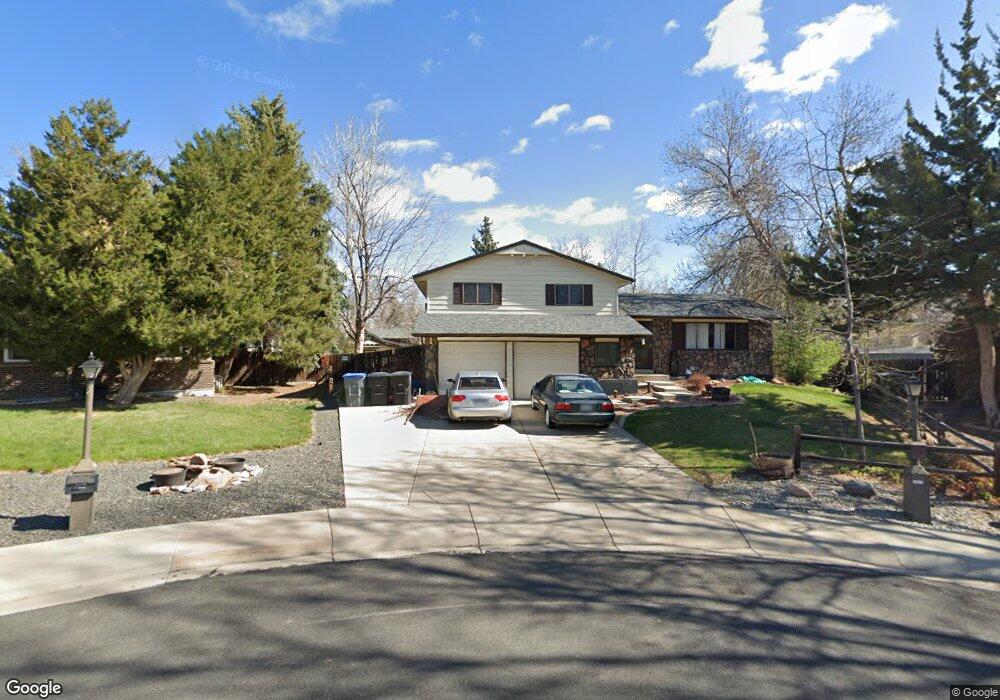
1132 Avon Ln Longmont, CO 80501
Southmoor NeighborhoodEstimated Value: $503,000 - $560,000
3
Beds
3
Baths
2,244
Sq Ft
$235/Sq Ft
Est. Value
About This Home
This home is located at 1132 Avon Ln, Longmont, CO 80501 and is currently estimated at $527,342, approximately $235 per square foot. 1132 Avon Ln is a home located in Boulder County with nearby schools including Burlington Elementary School, Sunset Middle School, and Niwot High School.
Ownership History
Date
Name
Owned For
Owner Type
Purchase Details
Closed on
May 24, 2001
Sold by
Haas Terry W
Bought by
Violett Russell C and Violett Janeen S
Current Estimated Value
Home Financials for this Owner
Home Financials are based on the most recent Mortgage that was taken out on this home.
Original Mortgage
$231,705
Outstanding Balance
$86,774
Interest Rate
7.07%
Estimated Equity
$440,568
Purchase Details
Closed on
Jan 26, 1998
Sold by
Haas Terry W and Haas Janet M
Bought by
Haas Terry W
Home Financials for this Owner
Home Financials are based on the most recent Mortgage that was taken out on this home.
Original Mortgage
$90,000
Interest Rate
7.07%
Purchase Details
Closed on
May 15, 1979
Bought by
Violett Russell C and Violett Janeen S
Purchase Details
Closed on
Mar 14, 1978
Bought by
Violett Russell C and Violett Janeen S
Create a Home Valuation Report for This Property
The Home Valuation Report is an in-depth analysis detailing your home's value as well as a comparison with similar homes in the area
Home Values in the Area
Average Home Value in this Area
Purchase History
| Date | Buyer | Sale Price | Title Company |
|---|---|---|---|
| Violett Russell C | $243,900 | First American Heritage Titl | |
| Haas Terry W | -- | -- | |
| Violett Russell C | $71,500 | -- | |
| Violett Russell C | $66,000 | -- |
Source: Public Records
Mortgage History
| Date | Status | Borrower | Loan Amount |
|---|---|---|---|
| Open | Violett Russell C | $231,705 | |
| Previous Owner | Haas Terry W | $90,000 |
Source: Public Records
Tax History Compared to Growth
Tax History
| Year | Tax Paid | Tax Assessment Tax Assessment Total Assessment is a certain percentage of the fair market value that is determined by local assessors to be the total taxable value of land and additions on the property. | Land | Improvement |
|---|---|---|---|---|
| 2025 | $2,990 | $32,226 | $14,988 | $17,238 |
| 2024 | $2,990 | $32,226 | $14,988 | $17,238 |
| 2023 | $2,949 | $31,256 | $18,713 | $16,227 |
| 2022 | $2,629 | $26,563 | $13,219 | $13,344 |
| 2021 | $2,663 | $27,327 | $13,599 | $13,728 |
| 2020 | $2,350 | $24,188 | $11,011 | $13,177 |
| 2019 | $2,313 | $24,188 | $11,011 | $13,177 |
| 2018 | $1,983 | $20,873 | $7,632 | $13,241 |
| 2017 | $1,956 | $23,076 | $8,438 | $14,638 |
| 2016 | $1,793 | $18,754 | $7,562 | $11,192 |
| 2015 | $1,708 | $15,729 | $4,696 | $11,033 |
| 2014 | $1,469 | $15,729 | $4,696 | $11,033 |
Source: Public Records
Map
Nearby Homes
- 1350 S Lincoln St
- 1435 Ashcroft Dr
- 919 S Sherman St
- 1072 Kane Dr
- 1456 Sepia Ave
- 832 S Bowen St
- 1518 Sepia Ave
- 1328 S Terry St
- 1801 S Pratt Pkwy
- 1327 Brookfield Dr
- 1343 S Coffman St
- 1208 S Coffman St
- 1435 Missouri Ave
- 1221 S Main St
- 835 Kane Dr Unit E25
- 9 Seattle Ln
- 1527 S Vivian St
- 922 S Coffman St
- 1028 Katy Ln
- 818 S Terry St Unit 98