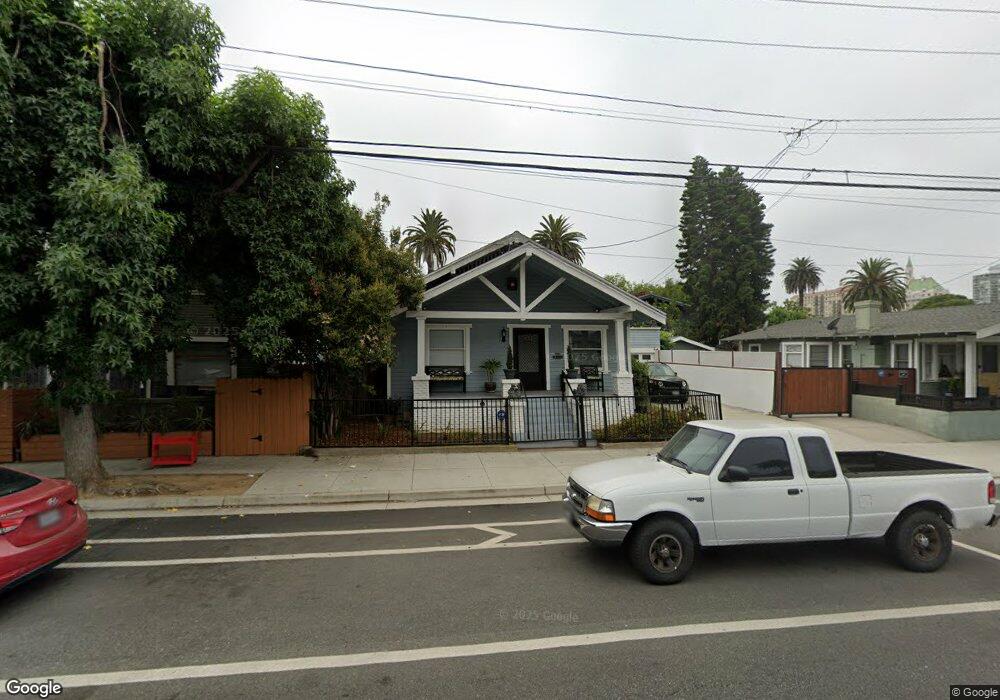
1132 E Broadway Long Beach, CA 90802
Alamitos Beach NeighborhoodEstimated Value: $848,674 - $924,000
2
Beds
1
Bath
1,104
Sq Ft
$802/Sq Ft
Est. Value
About This Home
This home is located at 1132 E Broadway, Long Beach, CA 90802 and is currently estimated at $885,169, approximately $801 per square foot. 1132 E Broadway is a home located in Los Angeles County with nearby schools including Stevenson Elementary School, Franklin Middle School, and Long Beach Polytechnic High School.
Ownership History
Date
Name
Owned For
Owner Type
Purchase Details
Closed on
Jun 29, 2020
Sold by
Martinez John L and Kimbel Michael Anthony
Bought by
Martinez John L and Kimbel Michael Anthony
Current Estimated Value
Home Financials for this Owner
Home Financials are based on the most recent Mortgage that was taken out on this home.
Original Mortgage
$417,000
Outstanding Balance
$370,454
Interest Rate
3.2%
Mortgage Type
New Conventional
Estimated Equity
$514,715
Purchase Details
Closed on
Sep 17, 2007
Sold by
Miller James Arthur and The 2001 James Arthur Miller T
Bought by
Kimbel Michael Anthony and Martinez John L
Home Financials for this Owner
Home Financials are based on the most recent Mortgage that was taken out on this home.
Original Mortgage
$399,200
Interest Rate
6.46%
Mortgage Type
Purchase Money Mortgage
Purchase Details
Closed on
Sep 13, 2005
Sold by
Miller James Arthur
Bought by
Miller James Arthur and 2001 James Arthur Miller Trust
Create a Home Valuation Report for This Property
The Home Valuation Report is an in-depth analysis detailing your home's value as well as a comparison with similar homes in the area
Home Values in the Area
Average Home Value in this Area
Purchase History
| Date | Buyer | Sale Price | Title Company |
|---|---|---|---|
| Martinez John L | -- | Old Republic Title Company | |
| Kimbel Michael Anthony | $499,000 | Chicago Title Company | |
| Miller James Arthur | -- | -- |
Source: Public Records
Mortgage History
| Date | Status | Borrower | Loan Amount |
|---|---|---|---|
| Open | Martinez John L | $417,000 | |
| Closed | Kimbel Michael Anthony | $399,200 |
Source: Public Records
Tax History
| Year | Tax Paid | Tax Assessment Tax Assessment Total Assessment is a certain percentage of the fair market value that is determined by local assessors to be the total taxable value of land and additions on the property. | Land | Improvement |
|---|---|---|---|---|
| 2025 | $8,261 | $655,431 | $524,350 | $131,081 |
| 2024 | $8,261 | $642,580 | $514,069 | $128,511 |
| 2023 | $8,121 | $629,982 | $503,990 | $125,992 |
| 2022 | $7,620 | $617,630 | $494,108 | $123,522 |
| 2021 | $7,470 | $605,520 | $484,420 | $121,100 |
| 2020 | $7,451 | $599,312 | $479,453 | $119,859 |
| 2019 | $7,362 | $587,561 | $470,052 | $117,509 |
| 2018 | $7,134 | $576,041 | $460,836 | $115,205 |
| 2016 | $5,294 | $444,000 | $355,000 | $89,000 |
| 2015 | $5,155 | $444,000 | $355,000 | $89,000 |
| 2014 | $5,568 | $475,000 | $380,000 | $95,000 |
Source: Public Records
Map
Nearby Homes
- 100 Cerritos Ave Unit 7
- 1149 E 1st St
- 1130 E 1st St
- 1116 E Appleton St
- 1020 E 2nd St Unit 10
- 1023 E 1st St Unit 19
- 1101 E Ocean Blvd
- 1101 E Ocean Blvd Unit 2
- 15 Cerritos Ave
- 1100 E 3rd St Unit 205
- 1013 E Appleton St Unit 1
- 930 E 1st St Unit 2
- 1140 E Ocean Blvd Unit 141
- 1140 E Ocean Blvd Unit 220
- 1140 E Ocean Blvd Unit 109
- 1140 E Ocean Blvd Unit 320
- 1140 E Ocean Blvd Unit 309
- 12 3rd Place
- 1 3rd Place Unit 2
- 1212 E 3rd St
- 1124 E Broadway
- 1138 E Broadway
- 1133 E 2nd St
- 1131 E 2nd St
- 1125 E 2nd St
- 1137 E 2nd St
- 1150 E Broadway
- 1145 E 2nd St
- 1115 E 2nd St
- 1137 E Broadway
- 1141 E Broadway Unit 2
- 1141 E Broadway Unit 3
- 1141 E Broadway Unit 4
- 1141 E Broadway Unit 1
- 1141 E Broadway
- 1152 E Broadway
- 1125 E Broadway
- 1145 E Broadway
- 1139 E Broadway
- 1115 E Broadway Unit 6
Your Personal Tour Guide
Ask me questions while you tour the home.