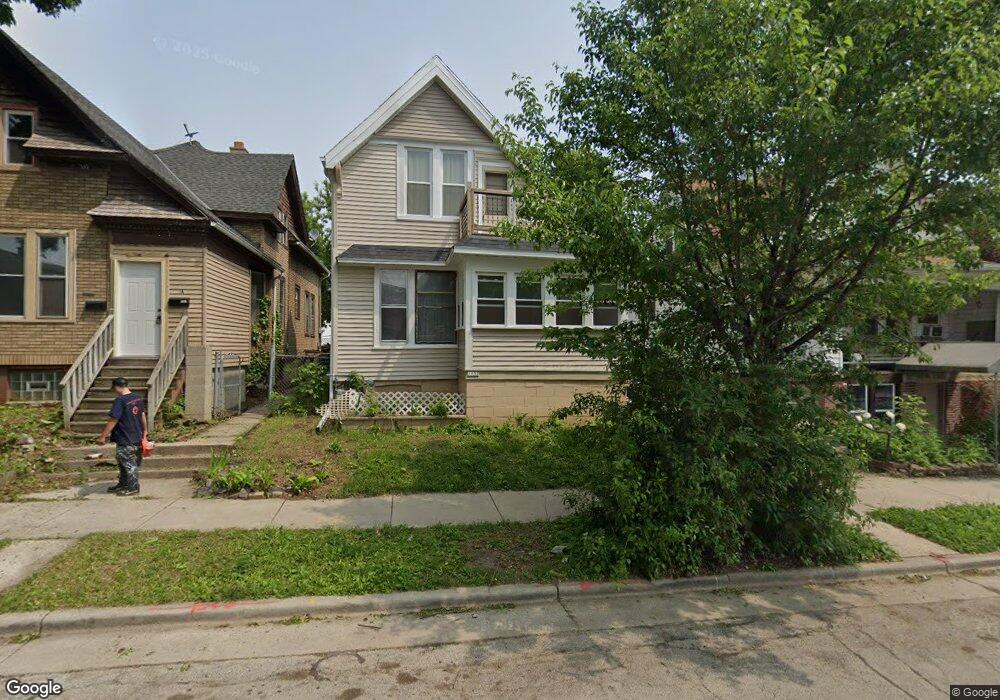
1132 E Clarke St Unit 1134 Milwaukee, WI 53212
Riverwest NeighborhoodEstimated Value: $180,000 - $305,000
3
Beds
2
Baths
1,517
Sq Ft
$161/Sq Ft
Est. Value
About This Home
This home is located at 1132 E Clarke St Unit 1134, Milwaukee, WI 53212 and is currently estimated at $244,006, approximately $160 per square foot. 1132 E Clarke St Unit 1134 is a home located in Milwaukee County with nearby schools including La Escuela Fratney, Craig Montessori School, and Milwaukee German Immersion School.
Ownership History
Date
Name
Owned For
Owner Type
Purchase Details
Closed on
Apr 23, 2024
Sold by
1132 Clarke Llc
Bought by
Aak Investments Llc
Current Estimated Value
Purchase Details
Closed on
Nov 16, 2012
Sold by
Peters Victoria Ann
Bought by
1123 Clarke Llc
Purchase Details
Closed on
Sep 6, 2011
Sold by
Peters Joseph R
Bought by
Peters Victoria Ann
Purchase Details
Closed on
Mar 9, 2011
Sold by
Bankunited
Bought by
Peters Joseph
Purchase Details
Closed on
Oct 20, 2010
Sold by
Lindell Jolene
Bought by
Bankunited
Purchase Details
Closed on
Feb 10, 2004
Sold by
Sjm Properties #2 Llc
Bought by
Lindell Rod and Lindell Jolene
Home Financials for this Owner
Home Financials are based on the most recent Mortgage that was taken out on this home.
Original Mortgage
$114,750
Interest Rate
8.35%
Mortgage Type
Purchase Money Mortgage
Create a Home Valuation Report for This Property
The Home Valuation Report is an in-depth analysis detailing your home's value as well as a comparison with similar homes in the area
Home Values in the Area
Average Home Value in this Area
Purchase History
| Date | Buyer | Sale Price | Title Company |
|---|---|---|---|
| Aak Investments Llc | $145,000 | None Listed On Document | |
| 1123 Clarke Llc | -- | None Available | |
| Peters Victoria Ann | -- | None Available | |
| Peters Joseph | $42,600 | None Available | |
| Bankunited | -- | None Available | |
| Lindell Rod | $135,000 | -- |
Source: Public Records
Mortgage History
| Date | Status | Borrower | Loan Amount |
|---|---|---|---|
| Previous Owner | Lindell Rod | $114,750 | |
| Closed | Lindell Rod | $20,250 |
Source: Public Records
Tax History Compared to Growth
Tax History
| Year | Tax Paid | Tax Assessment Tax Assessment Total Assessment is a certain percentage of the fair market value that is determined by local assessors to be the total taxable value of land and additions on the property. | Land | Improvement |
|---|---|---|---|---|
| 2024 | $4,299 | $191,300 | $36,000 | $155,300 |
| 2023 | $3,665 | $155,100 | $36,000 | $119,100 |
| 2022 | $3,620 | $155,100 | $36,000 | $119,100 |
| 2021 | $3,401 | $132,100 | $31,600 | $100,500 |
| 2020 | $3,382 | $132,100 | $31,600 | $100,500 |
| 2019 | $3,435 | $134,500 | $31,600 | $102,900 |
| 2018 | $3,413 | $134,500 | $31,600 | $102,900 |
| 2017 | $3,598 | $134,500 | $28,800 | $105,700 |
| 2016 | $3,567 | $126,900 | $28,800 | $98,100 |
| 2015 | -- | $118,600 | $28,800 | $89,800 |
| 2014 | -- | $118,600 | $28,800 | $89,800 |
| 2013 | -- | $118,600 | $28,800 | $89,800 |
Source: Public Records
Map
Nearby Homes
- 2562 N Weil St
- 915 E Clarke St
- 918 E Center St
- 930 E Hadley St
- 2833 N Weil St
- 2515 N Bartlett Ave Unit 2517
- 2670 N Holton St
- 820 E Locust St
- 2611 N Holton St
- 800 E Locust St
- 2671 N Holton St
- 2498 N Bartlett Ave
- 2505 N Oakland Ave
- 2636 N Buffum St
- 2847 N Booth St
- 2970 N Bremen St
- 606 E Locust St
- 2594 N Cramer St
- 2121 N Riverboat Rd Unit 2121
- 1828 E Greenwich Ave
- 1136 E Clarke St
- 1128 E Clarke St
- 1124 E Clarke St
- 1120 E Clarke St
- 2628 N Humboldt Blvd
- 2628 N Humboldt Blvd
- 1133 E Clarke St
- 1129 E Clarke St
- 1210 E Clarke St
- 1125 E Clarke St
- 1140 E Clarke St
- 1202 E Clarke St
- 1121 E Clarke St
- 1121 E Clarke St Unit 1121A
- 2606 N Humboldt Blvd Unit 2608
- 2610 N Humboldt Blvd Unit 2612
- 2616 N Humboldt Blvd
- 2571 N Dousman St
- 2600 N Humboldt Blvd
- 2572 N Dousman St