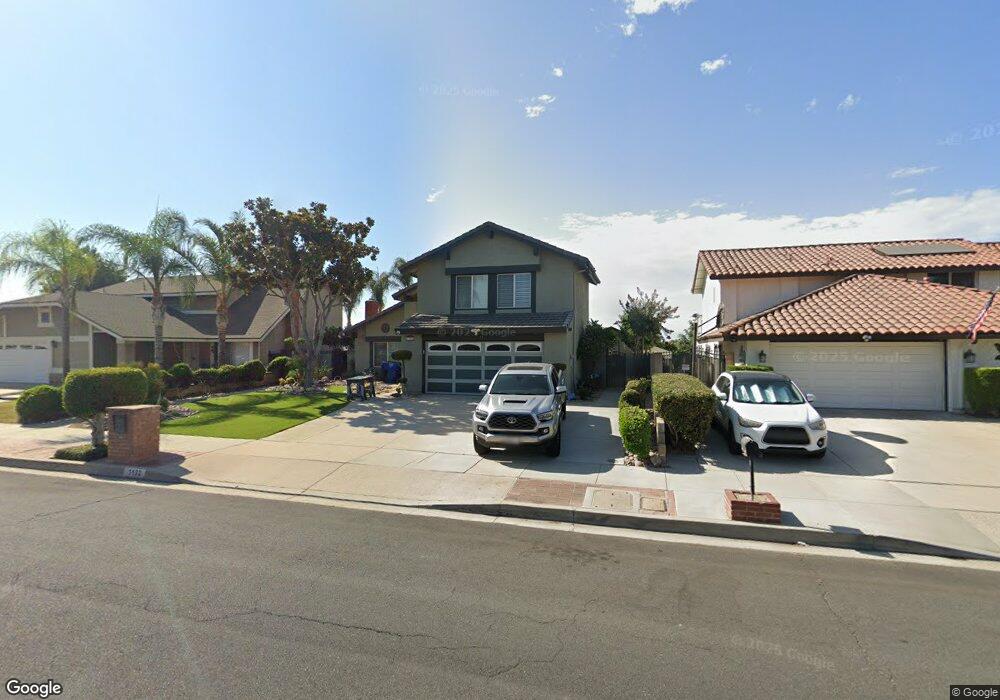
1132 E Saint Andrews St Ontario, CA 91761
Ontario Ranch NeighborhoodEstimated Value: $676,685 - $803,000
3
Beds
3
Baths
1,726
Sq Ft
$433/Sq Ft
Est. Value
About This Home
This home is located at 1132 E Saint Andrews St, Ontario, CA 91761 and is currently estimated at $746,921, approximately $432 per square foot. 1132 E Saint Andrews St is a home located in San Bernardino County with nearby schools including Liberty Elementary School, Woodcrest Junior High, and Chino High School.
Ownership History
Date
Name
Owned For
Owner Type
Purchase Details
Closed on
May 13, 2019
Sold by
Robinson Cesar A and The Cesar A Robinson Trust
Bought by
Cesar and Maritza Robinson Rlt
Current Estimated Value
Purchase Details
Closed on
Dec 27, 2001
Sold by
Robinson Cesar A
Bought by
Robinson Cesar A and The Cesar A Robinson Trust
Create a Home Valuation Report for This Property
The Home Valuation Report is an in-depth analysis detailing your home's value as well as a comparison with similar homes in the area
Home Values in the Area
Average Home Value in this Area
Purchase History
| Date | Buyer | Sale Price | Title Company |
|---|---|---|---|
| Cesar | -- | None Available | |
| Robinson Cesar A | -- | -- |
Source: Public Records
Tax History Compared to Growth
Tax History
| Year | Tax Paid | Tax Assessment Tax Assessment Total Assessment is a certain percentage of the fair market value that is determined by local assessors to be the total taxable value of land and additions on the property. | Land | Improvement |
|---|---|---|---|---|
| 2025 | $2,513 | $233,312 | $54,665 | $178,647 |
| 2024 | $2,513 | $228,737 | $53,593 | $175,144 |
| 2023 | $2,443 | $224,252 | $52,542 | $171,710 |
| 2022 | $2,428 | $219,855 | $51,512 | $168,343 |
| 2021 | $2,380 | $215,544 | $50,502 | $165,042 |
| 2020 | $2,349 | $213,334 | $49,984 | $163,350 |
| 2019 | $2,307 | $209,151 | $49,004 | $160,147 |
| 2018 | $2,256 | $205,050 | $48,043 | $157,007 |
| 2017 | $2,215 | $201,029 | $47,101 | $153,928 |
| 2016 | $2,072 | $197,087 | $46,177 | $150,910 |
| 2015 | $2,031 | $194,126 | $45,483 | $148,643 |
| 2014 | $1,990 | $190,323 | $44,592 | $145,731 |
Source: Public Records
Map
Nearby Homes
- 1020 E Tam o Shanter Ct
- 2453 S Marigold Place
- 2718 S Sandpiper Ave
- 2437 S Garfield Place
- 2919 S Caldwell Ave
- 2535 S Imperial Place
- 2817 S Lassen Ave
- 4235 S Gasly Paseo
- 0 Vineyard Unit CV25067044
- 4245 S Grasly Paseo
- 4233 S Grasly Paseo
- 0 Phillips Unit CV23180894
- 2408 S Taylor Place
- 2424 S Lake Ave
- 1456 E Philadelphia St Unit 134
- 1456 E Philadelphia St Unit 378
- 1456 E Philadelphia St
- 1456 E Philadelphia St Unit 279
- 1456 E Philadelphia St Unit 132
- 1456 E Philadelphia St Unit 39
- 1126 E Saint Andrews St
- 1138 E Saint Andrews St
- 1119 E Deerfield St
- 1111 E Deerfield St
- 1120 E Saint Andrews St
- 1144 E Saint Andrews St
- 1125 E Deerfield St
- 1131 E Saint Andrews St
- 1135 E Deerfield St
- 1150 E Saint Andrews St
- 1114 E Saint Andrews St
- 1137 E Saint Andrews St
- 1125 E Saint Andrews St
- 1103 E Deerfield St
- 1119 E Saint Andrews St
- 1141 E Deerfield St
- 1156 E Saint Andrews St
- 1108 E Saint Andrews St
- 2814 S Marigold Ave
- 2732 S Marigold Ave