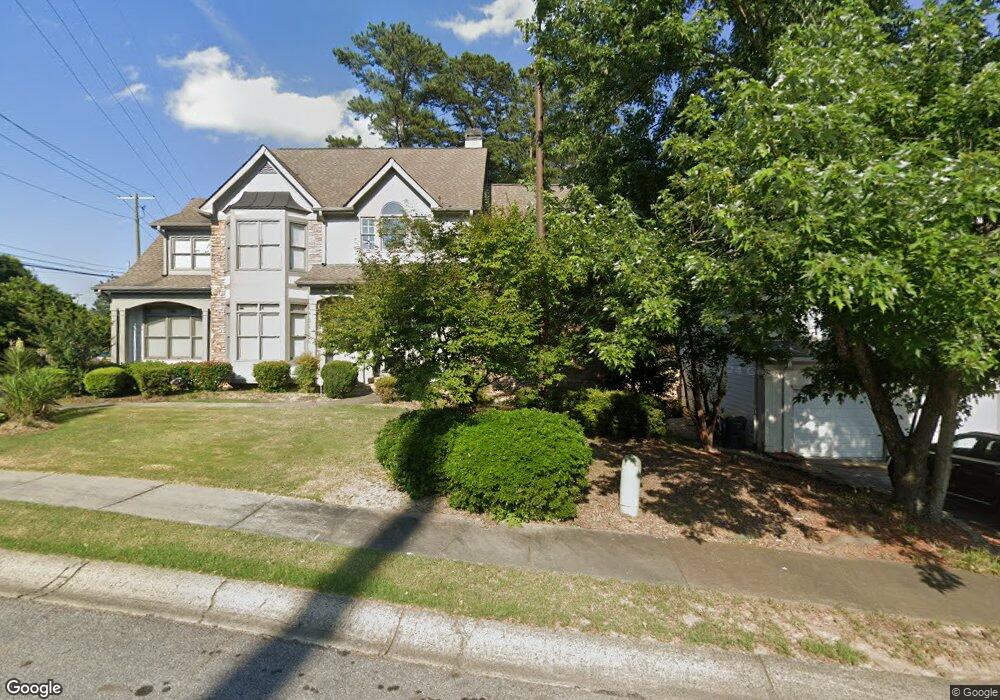
1132 Midsummer Ct NE Marietta, GA 30068
East Cobb NeighborhoodEstimated Value: $737,000 - $817,000
4
Beds
4
Baths
3,256
Sq Ft
$240/Sq Ft
Est. Value
About This Home
This home is located at 1132 Midsummer Ct NE, Marietta, GA 30068 and is currently estimated at $782,556, approximately $240 per square foot. 1132 Midsummer Ct NE is a home located in Cobb County with nearby schools including East Side Elementary School, Dodgen Middle School, and Walton High School.
Ownership History
Date
Name
Owned For
Owner Type
Purchase Details
Closed on
Mar 8, 2005
Sold by
An Mee S
Bought by
An Mee S and An Keum
Current Estimated Value
Home Financials for this Owner
Home Financials are based on the most recent Mortgage that was taken out on this home.
Original Mortgage
$309,400
Outstanding Balance
$155,709
Interest Rate
5.6%
Mortgage Type
New Conventional
Estimated Equity
$626,847
Purchase Details
Closed on
Oct 23, 2003
Sold by
Wells Fargo Hm Mtg Inc
Bought by
Keum Keum H and Keum Mee S
Home Financials for this Owner
Home Financials are based on the most recent Mortgage that was taken out on this home.
Original Mortgage
$200,000
Interest Rate
6%
Mortgage Type
New Conventional
Purchase Details
Closed on
May 6, 2003
Sold by
Newbill Ivano
Bought by
Wells Fargo Home Mortgage Inc
Purchase Details
Closed on
Feb 18, 1997
Sold by
Primary Capital Advoris Lc
Bought by
Newbill Ivano
Create a Home Valuation Report for This Property
The Home Valuation Report is an in-depth analysis detailing your home's value as well as a comparison with similar homes in the area
Home Values in the Area
Average Home Value in this Area
Purchase History
| Date | Buyer | Sale Price | Title Company |
|---|---|---|---|
| An Mee S | -- | -- | |
| An Mee S | -- | -- | |
| Keum Keum H | $281,900 | -- | |
| Wells Fargo Home Mortgage Inc | $270,000 | -- | |
| Newbill Ivano | $225,500 | -- |
Source: Public Records
Mortgage History
| Date | Status | Borrower | Loan Amount |
|---|---|---|---|
| Open | An Mee S | $309,400 | |
| Previous Owner | Keum Keum H | $200,000 | |
| Closed | Newbill Ivano | $0 |
Source: Public Records
Tax History Compared to Growth
Tax History
| Year | Tax Paid | Tax Assessment Tax Assessment Total Assessment is a certain percentage of the fair market value that is determined by local assessors to be the total taxable value of land and additions on the property. | Land | Improvement |
|---|---|---|---|---|
| 2025 | $1,608 | $247,180 | $41,400 | $205,780 |
| 2024 | $5,522 | $222,936 | $41,400 | $181,536 |
| 2023 | $4,979 | $222,936 | $41,400 | $181,536 |
| 2022 | $5,564 | $222,936 | $41,400 | $181,536 |
| 2021 | $4,912 | $193,132 | $41,400 | $151,732 |
| 2020 | $4,912 | $193,132 | $41,400 | $151,732 |
| 2019 | $4,912 | $193,132 | $41,400 | $151,732 |
| 2018 | $4,912 | $193,132 | $41,400 | $151,732 |
| 2017 | $4,772 | $193,876 | $45,000 | $148,876 |
| 2016 | $4,131 | $164,444 | $34,560 | $129,884 |
| 2015 | $3,661 | $139,448 | $32,000 | $107,448 |
| 2014 | $3,689 | $139,448 | $0 | $0 |
Source: Public Records
Map
Nearby Homes
- 1120 Taliwa Trail NE
- 2994 Octavia Cir
- 2880 Octavia Cir
- 2868 Octavia Cir
- 0 Old Canton Rd NE Unit 10567243
- 0 Old Canton Rd NE Unit 7617214
- 925 Sunny Meadows Ln
- 909 Sunny Meadows Ln
- 1246 Stonecroft Way
- 860 Mitsy Ridge Dr
- 2672 Roswell Rd
- 2650 Roswell Rd
- 1043 Sterling Ridge Chase NE
- 1043 Sterling Ridge Chase
- 1131 Hershey Dr
- 1519 Brookcliff Cir
- 2988 Nestle Creek Dr
- 1686 N Cobb Pkwy
- 0 Holly Springs Rd Unit 7637105
- 0 Holly Springs Rd Unit 10591415
- 1130 Midsummer Ct NE
- 1128 Midsummer Ct NE
- 2986 Roswell Rd
- 2976 Roswell Rd
- 1131 Midsummer Ct NE
- 1124 Midsummer Ct NE
- 1127 Midsummer Ct NE
- 1120 Midsummer Ct NE
- 0 Midsummer Ct NE Unit 7451425
- 0 Midsummer Ct NE Unit 7276672
- 0 Midsummer Ct NE Unit 7233982
- 0 Midsummer Ct NE Unit 8148316
- 0 Midsummer Ct NE Unit 3212833
- 0 Midsummer Ct NE
- 2950 Kaylyssa Ct
- 1118 Midsummer Ct NE
- 2930 Kaylyssa Ct
- 1189 Vester Dr
- 1125 Midsummer Ct NE
- 1121 Taliwa Trail NE