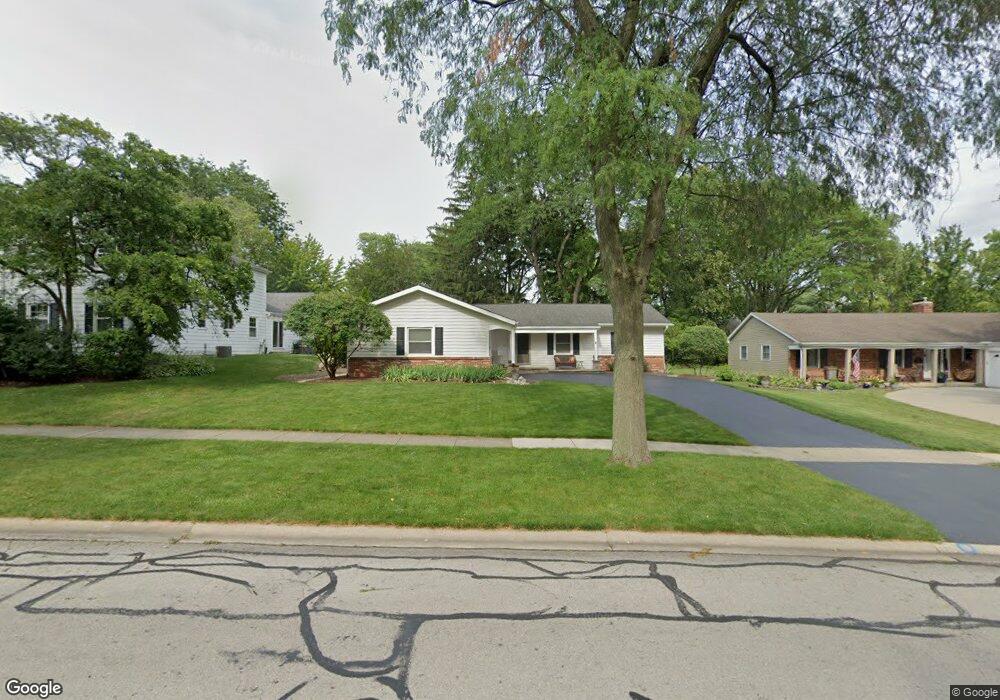
1132 N Loomis St Naperville, IL 60563
North Naperville NeighborhoodEstimated Value: $510,000 - $664,000
3
Beds
2
Baths
1,688
Sq Ft
$335/Sq Ft
Est. Value
About This Home
This home is located at 1132 N Loomis St, Naperville, IL 60563 and is currently estimated at $566,034, approximately $335 per square foot. 1132 N Loomis St is a home located in DuPage County with nearby schools including Nature Ridge Elementary School, Beebe Elementary School, and Jefferson Jr High School.
Ownership History
Date
Name
Owned For
Owner Type
Purchase Details
Closed on
Jun 9, 2017
Sold by
Rosecky Robert J and Rosecky Lavon D
Bought by
Krebs Jeffrey C
Current Estimated Value
Home Financials for this Owner
Home Financials are based on the most recent Mortgage that was taken out on this home.
Original Mortgage
$332,000
Outstanding Balance
$272,132
Interest Rate
3.5%
Mortgage Type
Adjustable Rate Mortgage/ARM
Estimated Equity
$293,902
Purchase Details
Closed on
Oct 1, 2012
Sold by
Rosecky Robert J and Rosecky Lavon
Bought by
Rosecky Robert J and Rosecky Lavon D
Purchase Details
Closed on
Apr 13, 1995
Sold by
Slotten James S and Slotten Debra S
Bought by
Rosecky Robert J and Rosecky Lavon
Home Financials for this Owner
Home Financials are based on the most recent Mortgage that was taken out on this home.
Original Mortgage
$132,000
Interest Rate
8.64%
Create a Home Valuation Report for This Property
The Home Valuation Report is an in-depth analysis detailing your home's value as well as a comparison with similar homes in the area
Home Values in the Area
Average Home Value in this Area
Purchase History
| Date | Buyer | Sale Price | Title Company |
|---|---|---|---|
| Krebs Jeffrey C | $415,000 | First American Title | |
| Rosecky Robert J | -- | None Available | |
| Rosecky Robert J | $182,000 | -- |
Source: Public Records
Mortgage History
| Date | Status | Borrower | Loan Amount |
|---|---|---|---|
| Open | Krebs Jeffrey C | $332,000 | |
| Previous Owner | Rosecky Robert J | $132,000 |
Source: Public Records
Tax History Compared to Growth
Tax History
| Year | Tax Paid | Tax Assessment Tax Assessment Total Assessment is a certain percentage of the fair market value that is determined by local assessors to be the total taxable value of land and additions on the property. | Land | Improvement |
|---|---|---|---|---|
| 2024 | $9,043 | $155,622 | $76,195 | $79,427 |
| 2023 | $8,709 | $142,030 | $69,540 | $72,490 |
| 2022 | $8,613 | $139,090 | $66,600 | $72,490 |
| 2021 | $8,297 | $133,830 | $64,080 | $69,750 |
| 2020 | $8,120 | $131,430 | $62,930 | $68,500 |
| 2019 | $7,882 | $125,750 | $60,210 | $65,540 |
| 2018 | $7,884 | $125,750 | $60,210 | $65,540 |
| 2017 | $7,724 | $121,510 | $58,180 | $63,330 |
| 2016 | $7,569 | $117,120 | $56,080 | $61,040 |
| 2015 | $7,518 | $110,290 | $52,810 | $57,480 |
| 2014 | $7,447 | $106,050 | $50,780 | $55,270 |
| 2013 | $7,335 | $106,300 | $50,900 | $55,400 |
Source: Public Records
Map
Nearby Homes
- 959 N Brainard St
- 930 N Loomis St
- 26W250 Case St
- 837 N Loomis St
- 1142 N Webster St
- 719 N Brainard St
- 717 N Brainard St
- 715 N Brainard St
- 1310 Eagle St
- 1314 N Eagle St
- 1528 Shenandoah Ln
- 905 N Webster St
- 1556 Shenandoah Ln
- 5S365 Vest Ave
- 1104 N Mill St Unit 205
- 1016 N Mill St Unit 5
- 27W141 48th St
- 636 E 4th Ave
- 1105 N Mill St Unit 224
- 328 E 4th Ave
- 404 E 12th Ave
- 1128 N Loomis St
- 412 E 12th Ave
- 405 Blue Grass Ct
- 409 Blue Grass Ct
- 1133 N Loomis St
- 416 E 12th Ave
- 1137 N Loomis St
- 1129 N Loomis St
- 1204 N Loomis St Unit 2
- 413 E 12th Ave
- 409 E 12th Ave
- 413 Blue Grass Ct
- 504 E 12th Ave
- 1121 N Loomis St
- 313 E 12th Ave
- 417 E 12th Ave
- 1136 N Brainard St
- 417 Blue Grass Ct
- 404 Blue Grass Ct Unit 2