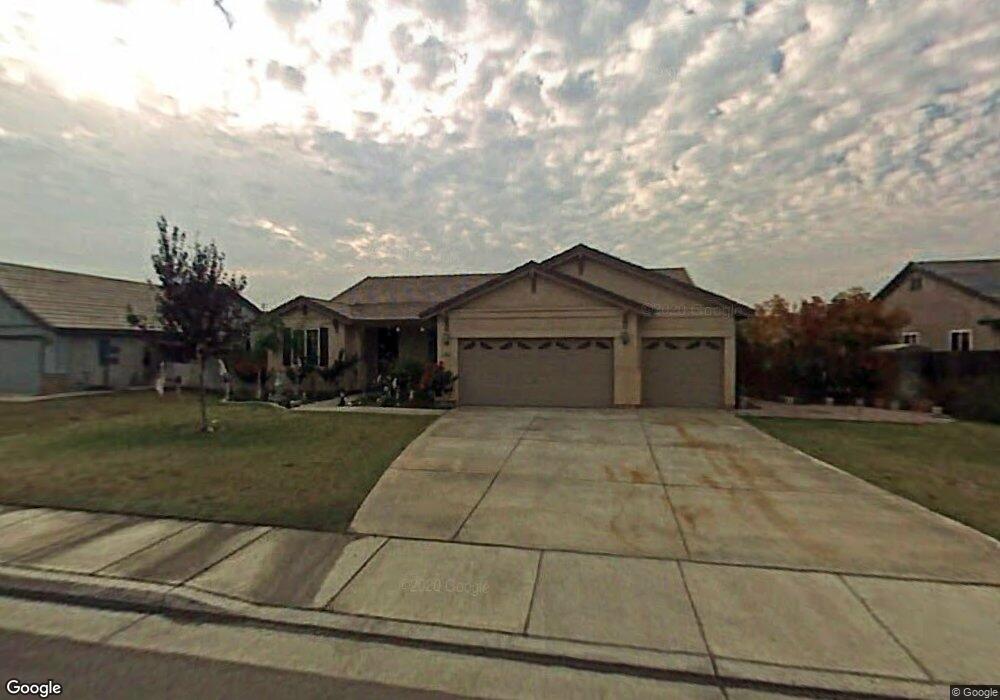
11321 Traviso Ave Unit 2 Bakersfield, CA 93312
Estimated Value: $473,881 - $547,000
4
Beds
2
Baths
2,339
Sq Ft
$217/Sq Ft
Est. Value
About This Home
This home is located at 11321 Traviso Ave Unit 2, Bakersfield, CA 93312 and is currently estimated at $508,720, approximately $217 per square foot. 11321 Traviso Ave Unit 2 is a home located in Kern County with nearby schools including Norris Elementary School, Norris Middle School, and Frontier High School.
Ownership History
Date
Name
Owned For
Owner Type
Purchase Details
Closed on
Oct 4, 2013
Sold by
Subia Yvonne
Bought by
Subia Yvonne and Garcia Angel P
Current Estimated Value
Purchase Details
Closed on
May 9, 2002
Sold by
Centex Homes
Bought by
Subia Yvonne
Home Financials for this Owner
Home Financials are based on the most recent Mortgage that was taken out on this home.
Original Mortgage
$156,544
Interest Rate
6.16%
Purchase Details
Closed on
Apr 3, 2002
Sold by
Centex Homes
Bought by
Riddle Ryan A
Home Financials for this Owner
Home Financials are based on the most recent Mortgage that was taken out on this home.
Original Mortgage
$156,544
Interest Rate
6.16%
Create a Home Valuation Report for This Property
The Home Valuation Report is an in-depth analysis detailing your home's value as well as a comparison with similar homes in the area
Home Values in the Area
Average Home Value in this Area
Purchase History
| Date | Buyer | Sale Price | Title Company |
|---|---|---|---|
| Subia Yvonne | -- | Placer Title Company | |
| Subia Yvonne | $174,000 | Commerce Title | |
| Riddle Ryan A | $209,500 | Commerce Title |
Source: Public Records
Mortgage History
| Date | Status | Borrower | Loan Amount |
|---|---|---|---|
| Previous Owner | Subia Yvonne | $156,544 | |
| Previous Owner | Riddle Ryan A | $167,399 | |
| Closed | Riddle Ryan A | $31,387 |
Source: Public Records
Tax History Compared to Growth
Tax History
| Year | Tax Paid | Tax Assessment Tax Assessment Total Assessment is a certain percentage of the fair market value that is determined by local assessors to be the total taxable value of land and additions on the property. | Land | Improvement |
|---|---|---|---|---|
| 2025 | $4,823 | $283,439 | $57,936 | $225,503 |
| 2024 | $4,729 | $277,882 | $56,800 | $221,082 |
| 2023 | $4,729 | $272,434 | $55,687 | $216,747 |
| 2022 | $4,658 | $267,094 | $54,596 | $212,498 |
| 2021 | $4,564 | $261,858 | $53,526 | $208,332 |
| 2020 | $4,447 | $259,174 | $52,978 | $206,196 |
| 2019 | $4,379 | $259,174 | $52,978 | $206,196 |
| 2018 | $4,271 | $249,111 | $50,921 | $198,190 |
| 2017 | $4,251 | $244,228 | $49,923 | $194,305 |
| 2016 | $4,027 | $239,440 | $48,945 | $190,495 |
| 2015 | $3,959 | $235,844 | $48,210 | $187,634 |
| 2014 | $3,875 | $231,225 | $47,266 | $183,959 |
Source: Public Records
Map
Nearby Homes
- 11326 Valletta Ave Unit 2
- 11311 Mezzadro Ave Unit 3
- 11404 Mantova Ave
- 11302 Mantova Ave
- 11016 Snowcreek Falls Ave
- 11603 Bocelli Ave
- 10929 Cypress Falls Ave
- 11502 Summit Point Ct
- 7220 Mist Falls Dr
- 11712 Novara Ave
- 10716 Alexander Falls Ave
- 6824 Chinook Falls Dr
- 12016 Cedar Bluff Ave Unit 2
- 11713 Darlington Ave
- 11018 Sonoma Creek Ct
- 7114 Ellington Dr
- 6701 Savannah Falls Dr Unit 2
- 10424 Malaguena Ct
- 12200 Verdelho Ave
- 11315 Traviso Ave Unit 2
- 11329 Traviso Ave
- 11322 Montague Ave Unit 2
- 11316 Montague Ave
- 11330 Montague Ave
- 11411 Traviso Ave
- 11309 Traviso Ave
- 11320 Traviso Ave
- 11314 Traviso Ave Unit 2
- 11328 Traviso Ave
- 11412 Montague Ave
- 11310 Montague Ave Unit 2
- 11417 Traviso Ave Unit 2
- 11410 Traviso Ave Unit 2
- 11308 Traviso Ave
- 11303 Traviso Ave
- 11418 Montague Ave Unit 2
- 11416 Traviso Ave Unit 2
- 11323 Montague Ave Unit 2
- 11319 Valletta Ave Unit 2