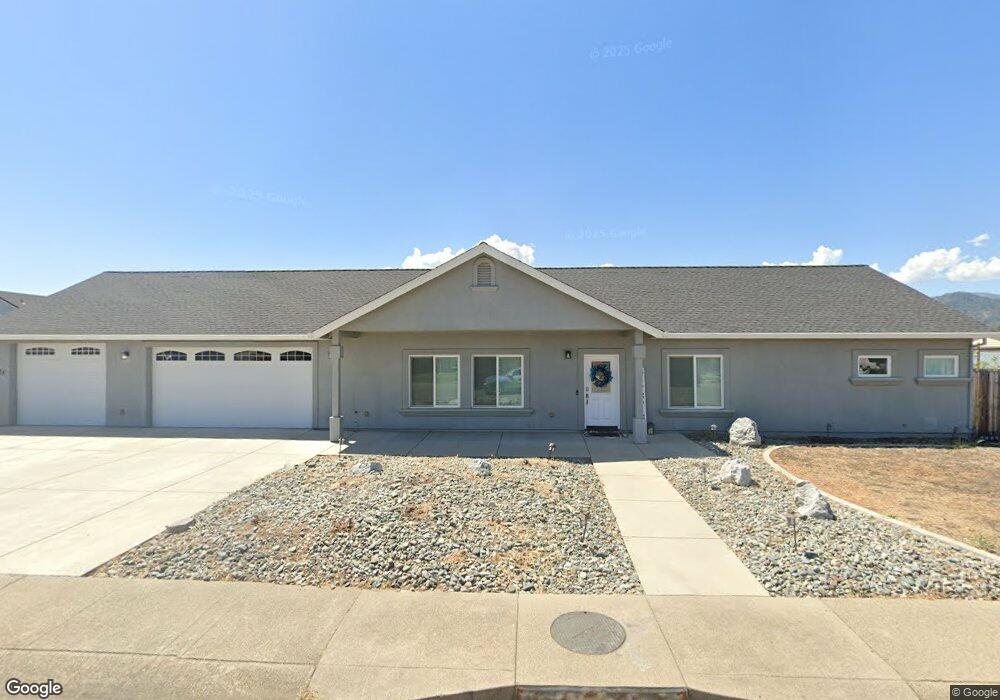
11324 Menlo Way Redding, CA 96003
Estimated Value: $411,323 - $456,000
3
Beds
2
Baths
1,800
Sq Ft
$239/Sq Ft
Est. Value
About This Home
This home is located at 11324 Menlo Way, Redding, CA 96003 and is currently estimated at $430,331, approximately $239 per square foot. 11324 Menlo Way is a home located in Shasta County with nearby schools including Redding STEM Academy.
Ownership History
Date
Name
Owned For
Owner Type
Purchase Details
Closed on
Mar 20, 2015
Sold by
Ichida Lee Y
Bought by
Saechao Low C and Saechao Melissa F
Current Estimated Value
Home Financials for this Owner
Home Financials are based on the most recent Mortgage that was taken out on this home.
Original Mortgage
$108,163
Interest Rate
3.81%
Mortgage Type
New Conventional
Purchase Details
Closed on
May 28, 1999
Sold by
Ichida Yoshimi
Bought by
Ichida Sharon
Purchase Details
Closed on
May 11, 1999
Sold by
Sharon Ichida
Bought by
Ichida Sharon
Purchase Details
Closed on
May 23, 1998
Sold by
Sharon Ichida
Bought by
Ichida Sharon
Create a Home Valuation Report for This Property
The Home Valuation Report is an in-depth analysis detailing your home's value as well as a comparison with similar homes in the area
Purchase History
| Date | Buyer | Sale Price | Title Company |
|---|---|---|---|
| Saechao Low C | $106,000 | Fidelity Natl Title Co Of Ca | |
| Ichida Sharon | -- | Placer Title Company | |
| Ichida Sharon | -- | Placer Title Company | |
| Ichida Sharon | -- | -- |
Source: Public Records
Mortgage History
| Date | Status | Borrower | Loan Amount |
|---|---|---|---|
| Previous Owner | Saechao Low C | $108,163 |
Source: Public Records
Tax History
| Year | Tax Paid | Tax Assessment Tax Assessment Total Assessment is a certain percentage of the fair market value that is determined by local assessors to be the total taxable value of land and additions on the property. | Land | Improvement |
|---|---|---|---|---|
| 2025 | $2,886 | $274,264 | $60,089 | $214,175 |
| 2024 | $2,830 | $268,887 | $58,911 | $209,976 |
| 2023 | $2,830 | $263,615 | $57,756 | $205,859 |
| 2022 | $2,753 | $258,447 | $56,624 | $201,823 |
| 2021 | $2,716 | $253,380 | $55,514 | $197,866 |
| 2020 | $2,704 | $250,783 | $54,945 | $195,838 |
| 2019 | $430 | $45,000 | $45,000 | $0 |
| 2018 | $559 | $211,250 | $52,812 | $158,438 |
| 2017 | $2,328 | $207,109 | $51,777 | $155,332 |
| 2016 | $2,227 | $203,049 | $50,762 | $152,287 |
| 2015 | $2,126 | $193,796 | $50,999 | $142,797 |
| 2014 | $1,688 | $156,093 | $40,172 | $115,921 |
Source: Public Records
Map
Nearby Homes
- 17014 Keswick Dam Rd
- 11326 Puffin Way
- 17007 Keswick Dam Rd
- 16810 Winchell Dr
- 1384 Spinnaker Dr
- 3509 Old Lantern Dr
- 1378 Spinnaker Dr
- 2580 Keswick Dam Rd
- 4806 Ferrington Ct
- 4846 Ferrington Ct
- 950 Santa Cruz Dr
- 878 Coggins St
- 871 Santa Cruz Dr
- 11746 Nash Rd
- 3360 Stanford Dr
- 835 Santa Cruz Dr
- 3082, 3060 Keswick Dam Rd
- 166 Quartz Hill Rd
- 605 Quartz Hill Rd
- 832 Santa Cruz Dr
- 16981 Cape Cod Dr
- 16984 Catalina Way
- 16980 Catalina Way
- 11332 Menlo Way
- 11321 Menlo Way Unit 1
- 11321 Menlo Way
- 16961 Cape Cod Dr
- 11313 Menlo Way
- 11329 Menlo Way
- 11341 Puffin Way
- 11305 Menlo Way
- 11325 Puffin Way
- 11333 Menlo Way
- 11336 Menlo Way
- 16953 Cape Cod Dr
- 16974 Catalina Way
- 11333 Puffin Way
- 11297 Menlo Way
- 11335 Menlo Way
- 11340 Menlo Way
Your Personal Tour Guide
Ask me questions while you tour the home.